Evaluating School Districts’ Unencumbered Cash Balances
Introduction
2019 House Substitute for Senate Bill 16 requires this audit, which the Legislative Post Audit Committee authorized at its October 2, 2019 meeting.
Objectives, Scope, & Methodology
Our audit objective was to answer the following questions:
- How has the amount of school districts’ unencumbered cash balances changed over the last 10 years?
- How have school districts spent their unencumbered cash balances in recent years?
Our work evaluated school district cash balances for school years 2009 through 2019.
We reviewed state law and guidance documents that the Kansas State Department of Education (KSDE) provides to school districts. We also interviewed stakeholders, school district administrators, and KSDE officials.
We analyzed cash balance data for all 286 school districts. We also chose 25 districts to review in more depth. We chose these districts to get a reasonable cross-section of districts. For those 25 districts, we talked to administrators and reviewed school district and KSDE documents to determine how they spent their cash balances. Additionally, we reviewed best practices related to how districts should maintain cash balances. We compared district cash balances to those best practices. This work cannot be projected because we did not randomly select the school districts. More specific details about the scope of our work and the methods we used are included throughout the report as appropriate.
Important Disclosures
We conducted this performance audit in accordance with generally accepted government auditing standards. Those standards require that we plan and perform the audit to obtain sufficient, appropriate evidence to provide a reasonable basis for our findings and conclusions based on our audit objectives. Overall, we believe the evidence obtained provides a reasonable basis for our findings and conclusions based on those audit objectives.
Audit standards require us to report our work on internal controls relevant to our audit objectives. They also require us to report deficiencies we identify. In this audit, we talked with district officials about their policies related to cash balances. The results of that work are detailed in this report.
After adjusting for inflation, districts’ cash balances increased 35% over the last 10 years but most growth was in just 10 funds.
State law provides funding to school districts and sets rules for how they may spend that money.
- State law provides funding to school districts through many methods. For example, base state aid provides a flat amount per full-time-equivalent student in the district. Additionally, weightings provide extra funding per student (or full-time-equivalent) who meet certain criteria. Other funding is based on the property wealth of the district. For example, districts who have a low assessed valuation per pupil (a measurement of property wealth) are eligible for certain types of additional state funding
- According to state law, some funding types can be used for only one purpose. For example, special education funding must be used to provide services for special education students only. State law also requires that at-risk funds be used for specific types of expenditures.
- Conversely, other funding types can be used for general purposes at the district’s discretion. For example, districts can use base state aid for a wide range of purposes including salaries, electric bills, and textbooks.
Districts account for the local, state, and federal money they receive using various funds.
- State law often requires districts to spend money from specific funds. For example, state law establishes a bilingual fund in every school district. It then requires that expenditures directly related to bilingual education be paid from that fund. As a result, when districts receive money, they transfer it into the appropriate fund. Then they spend and account for those expenditures by each fund.
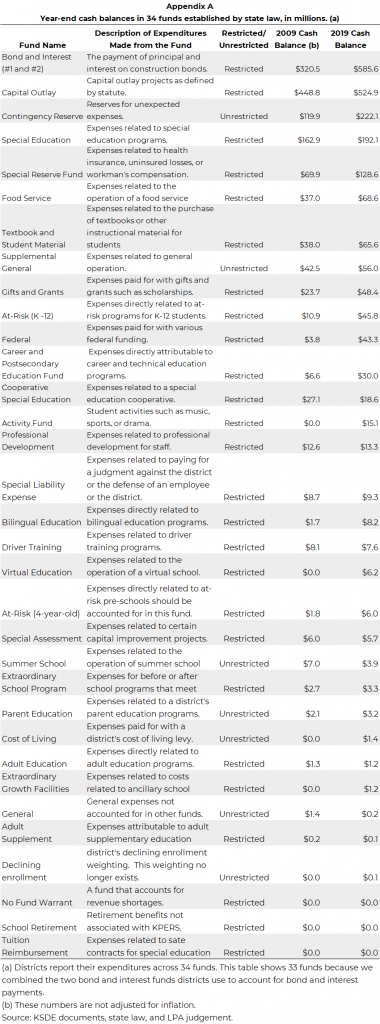
- Districts typically have at least 34 funds that track expenditures made from local, state, and federal money. Examples include food service, at-risk, special education, and capital outlay funds. Appendix A provides more information about these funds.
A fund can have a cash balance if the district transfers more funding into it than it spends.
- For many funds, state law allows districts to keep unspent funding from one year and spend it in following years. For example, districts can keep unspent bilingual and at-risk funds to use in future years.
- When the district transfers more funding into a fund than it spends in that year, it creates a cash balance in that fund. Districts may also choose to spend exactly the amount in the fund and not carry a cash balance at all. Districts rarely run a negative cash balance in a fund (the federal fund is an exception).
- When a district creates a cash balance, they may spend that balance at any time. Sometimes the district spends all or part of its balance in the following year. Other times, a district may choose to maintain that balance for many years.
- In certain circumstances, a district may “encumber” or earmark unspent funds. Districts most often do this when a bill will not come due until after the fiscal year but must be paid for with current year funds. In this case, there is money in the fund (a cash balance) at year end. However, it is encumbered or earmarked for future specific spending.
- Unencumbered monies are cash balances that can be used for any allowable purpose at any time. These are the funds we evaluated in this audit.
Districts maintain unencumbered cash balances for several reasons but receive little guidance about how much balance to maintain.
- Districts maintain unencumbered cash balances for many reasons, including:
- Districts maintain cash balances to pay for unexpected expenses. These can include increased costs related to snow removal or to fix a broken furnace.
- Districts may need to save over an extended time to pay for planned purchases such as a new roof or new textbooks.
- Districts use balances to manage cash flow. School district funding comes periodically throughout the year. For example, school districts start paying special education staff and buying materials for students in August but do not receive their first special education funding payment until October. To pay their bills at the beginning of the year, they must set aside money from the previous year.
- Districts maintain balances to mitigate instability in funding. In past recessions, the state has delayed or cut funding to districts. For example, in December 2009 the state delayed $173 million in payments to school districts. Cash balances allow the district to continue paying its bills when funding is late or unexpectedly cut.
- State law does not set requirements or limits for how much cash balances districts should maintain.
- KSDE does not provide much guidance to districts about how much cash balances they should maintain. The department does not have any legal authority to require districts to maintain any specific amount of cash balance. However, KSDE monitors balances on a periodic basis and notifies districts whose balances are significantly above or below average.
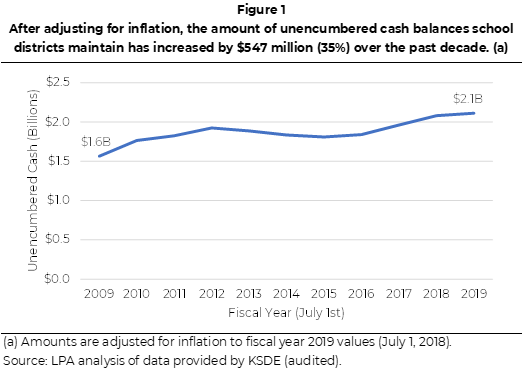
After adjusting for inflation, total unencumbered cash balances statewide grew 35% from $1.56 billion to $2.11 billion in school years 2009 to 2019.
- We used data from KSDE to determine how much unencumbered cash balances districts had in each year from 2009 to 2019. School districts report this information to KSDE annually. We reviewed the July 1 report for each school year.
- After adjusting for inflation, we found total unencumbered cash balances grew $547 million (35%) from 2009 to 2019. Figure 1 shows the total amount of unencumbered cash balances as of July 1 in each school year from 2009 to 2019. As the figure shows, unencumbered cash balances increased from $1.56 billion in 2009 to $2.11 billion in 2019, statewide.
- Unencumbered cash balances have also increased compared to total expenditures and on a per student basis.
- After adjusting for inflation, from 2009 to 2019, unencumbered cash balances increased by 35% while total expenditures decreased by 0.5%.
- On a per student basis, unencumbered cash balances grew 35% from $3,109 to $4,202 (after adjusting for inflation).
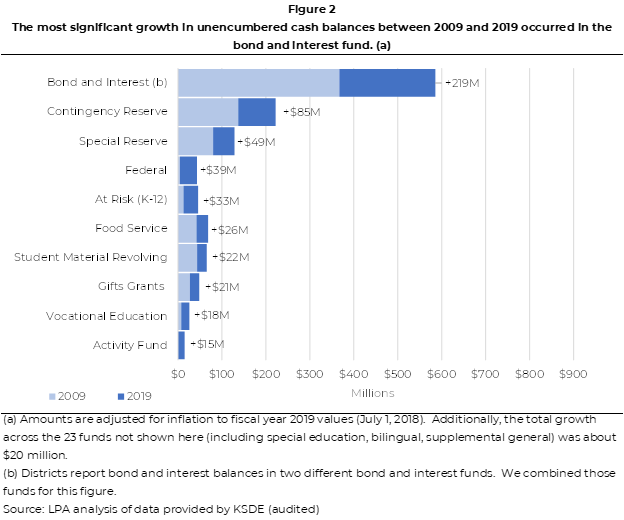
Almost all the growth in unencumbered cash balances over the last 10 years has occurred in just 10 funds.
- We evaluated unencumbered cash balances in the 34 funds that K-12 districts report to KSDE.
- Figure 2 shows the increase in cash balances by certain funds from 2009 to 2019. After adjusting for inflation, we found that 96% ($527 million) of the $547 million increase in unencumbered cash balances occurred in just 10 funds. As the figure shows, the bond and interest and the contingency reserve funds have grown the most. These two funds account for $303 million or 55% of all growth in unencumbered cash balances from 2009 to 2019.
- School districts use bond and interest funds to pay off the bonds used to finance large projects. KSDE told us the significant increase in bond and interest fund cash balances may be related to a couple factors.
- According to the Bureau of Labor Statistics, school building construction costs increased by 32% from 2009 to 2019. Thus, the cost of a project in 2019 is a third more than the cost of that same project in 2009. As projects become more expensive, the district must issue more bonds to finance them which results in higher balances in the bond and interest fund.
- Legislative changes made in 2015 to bond and interest state aid reduce the amount of state aid districts receive. As a result, the district must pay for a greater percentage of the project than they would before the change. To do this, they must raise more revenue which results in more money in the bond and interest fund over time. Prior to 2015, the amount of bond and interest state aid a district could receive was based on the median assessed valuation per pupil (AVPP). In 2015 the Legislature changed that to base it on the district with the lowest AVPP. However, that district is an outlier (Fort Leavenworth) which decreases the aid all districts are eligible for. In 2019, the Legislature considered legislation that would change this, but it was not passed before the shortened COVID-19 session ended. Legislative Research estimated making this change would increase bond and interest state aid to school districts by 24%.
- School districts use the contingency reserve fund to save money for unexpected expenditures. The increase in contingency reserve funds may be related to district decisions since the 2009 recession. Some districts told us they increased their cash balances after the recession to better manage funding cuts. Others told us they increased their balances so they would have funds available if the state delayed school aid payments.
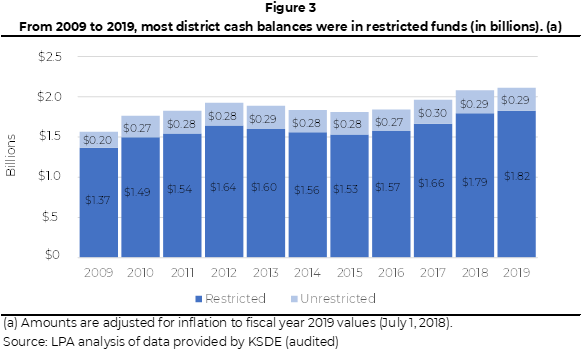
During the 10 years we evaluated, most unencumbered cash balances were in restricted funds, limiting districts’ spending flexibility.
- Money in restricted funds can only be used for specific purposes. Typically, we considered a fund restricted for one of two reasons:
- The state provides a dedicated funding source that is for a specific purpose. For example, a district can spend special education funding only on services for students who qualify for special education services. As a result, these types of funds are restricted.
- The funding does not come solely from a dedicated source, but any money in the fund must be spent on a specific purpose. For example, money in the bond and interest fund may include both state and local money but must be spent to pay off the district’s bonds. Food service, special reserve, and bilingual funds are other examples of funds that have several sources, but any money spent from the fund is restricted to specific purposes.
- Conversely, districts can spend from other funds for a variety of purposes at the discretion of the school district. The contingency reserve and general funds are examples of unrestricted funds that can be used for nearly any purpose.
- Figure 3 shows total cash balances by restricted and unrestricted funds in each year we reviewed (after adjusting for inflation). As the figure shows, in each of the 10 years we reviewed, most district cash balances were in restricted funds. For example, in 2019 $1.8 billion of the total $2.1 billion (86%) in cash balances were in restricted funds.
- This means districts often have limited flexibility in spending, especially when their needs change. For example, a district may find that its special education expenditures have increased but its bilingual expenditures have decreased. However, the district cannot divert excess money in the bilingual fund to special education. This can result in growing cash balances in the bilingual fund while the district must find other general resources to pay for the increased special education costs.
In school years 2009 to 2019, the 25 districts we reviewed spent most of their unencumbered cash balances on purchases related to construction or maintenance of school buildings.
We reviewed in detail how 25 school districts spent their cash balances.
- We chose those 25 districts (out of 286 total districts) for variety in their size, location, and amount of cash balances. The results cannot be projected to all districts because we did not randomly select the districts.
- In each district, we reviewed the district’s unencumbered cash balances as of July 1 for 10 funds from school years 2009 to 2019. We chose the 10 funds because most unencumbered cash balances in those districts are accounted for in those funds. We reviewed the same 10 funds in each school district.
- Although statewide total cash balances increased over the 10 years we reviewed, cash balances in individual district funds sometimes decreased. We identified instances where a fund had a significant cash balance decrease from one year to the next. We then talked to the district and reviewed relevant documents to determine why cash balances fell.
- In some cases, cash balances fell for multiple reasons. For example, the district may have received less funding and made a significant purchase. Either of these things could cause cash balances to fall. We used our best judgment to determine which factor appeared to be the primary reason a district’s cash balance decreased.
- We cannot say with certainty the source of the money districts spent. The money spent from the funds we reviewed is typically a mix of current year state or local funding and money saved from previous years. When a district’s cash balance decreased due to an expenditure, we assumed the district spent its cash balances.
- Last, we only reviewed obvious decreases in cash balances. In certain instances, a district may have spent its cash balances, but we could not identify the expenditure. This could happen if a district spent its cash balances but then transferred an amount into that fund that met or exceeded the expenditure. In that case, year over year cash balances would not decrease and we would not have identified the expenditure.
Districts spent the majority of the unencumbered cash balances we reviewed on building construction, renovation, or maintenance.
- We identified $152.2 million in cash balance decreases across the 10 years and 25 districts we selected. Out of that, we reviewed in-depth $137.7 million (91%) of the total we identified.
- Of the $137.7 million we reviewed, $105.5 million (77%) was spent on tangible purchases. These included:
- $75.6 million spent on building construction, renovation, or maintenance. This includes HVAC repair, land acquisition, architect fees, and bond payments.
- $27.1 million spent on regular operating expenditures. This includes salaries, supplies, and textbooks.
- $2.9 million spent on equipment. This included computers, vehicles, and copiers.
- We identified an additional $32.2 million (23%) in cash balance decreases that did not appear to be related to an expenditure. These decreases in cash balances often occurred when a district transferred less money into a fund than it had in previous years. When this happened, cash balances fell.
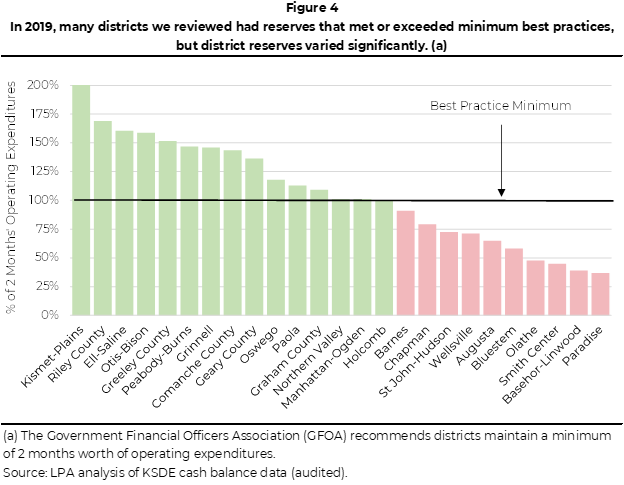
At the beginning of the 2019 school year, many of the districts we reviewed had cash balances that met or exceeded minimum amounts suggested by best practices, but the levels varied significantly.
- The Government Finance Officers Association (GFOA) recommends districts maintain a total cash balance of at least two months of operating expenditures. Best practices also urge districts to consider their risk level in determining what their reserves should be. Risks can include the relative size of the budget, revenue stability, and any other unique circumstances the district may face. Districts that identify more risks should have higher cash balances. State law does not require districts to follow these best practices.
- We did not review the risks in each district. The risks an individual school district faces are often subjective and change regularly. Different districts may assess the same risks differently based on the makeup of the school board or community preferences. Further, risks change over time due to funding fluctuations or local economic conditions.
- We used KSDE data to determine how 25 districts’ cash balances compared to their operating expenditures. In this calculation, we excluded certain funds, including:
- Funds we did not consider operating expenditures such as bond and interest and capital outlay.
- Certain federal funds because the federal government has its own rules that determine how districts maintain balances in those funds.
- KPERS expenditures because the state pays the district’s share, so they are not truly district expenditures.
- Many of the 25 districts we reviewed had 2019 balances that met or exceeded GFOA’s minimum recommendation (without considering risk). Figure 4 shows how each district compares to the GFOA minimum. As the figure shows, balances met or exceeded the best practice minimum in 15 (60%) districts. However, districts’ balances varied significantly from 37% to 200% of the minimum. Last, we did not detect any patterns between how districts compare to the GFOA minimum and factors such as size or type of district.
- Best practices also recommend that districts have a formal policy about how much balance the district should maintain and how those reserves can be spent. None of the 25 districts we reviewed had written policies in these areas. However, some had informal goals regarding the amount they wanted to maintain. Additionally, one district told us the district board approves reserve levels each year.
- As mentioned before, state law does not set an amount of cash balances that district must maintain. Additionally, although KSDE monitors district balances, they do not provide much guidance as to the appropriate amount to maintain.
Conclusion
It makes sense that school districts maintain at least some cash balances in their various funds. Doing so helps them address cash flow issues and helps them cover unexpected expenses like roof repairs or snow removal. Moreover, cash balances provide some financial protection during economic recessions (which has led to a delayed payment by the state at least once in the past 10 years we reviewed). However, it is less clear how much of a balance districts should maintain. The state provides little guidance, and best practices make it clear that recommended balance levels should be adjusted based on the unique financial situation of individual districts. Consequently, balance levels vary significantly across individual districts and make it difficult to conclude whether districts have too much or too little in reserve.
Recommendations
We did not make any recommendations for this audit.
Agency Response
On September 23, 2020 we provided the draft audit report to the Kansas Department of Education. Because we did not make any recommendations, a written response by the department was optional. The department chose to not submit a response.
Appendix A – Fund Information
This appendix includes additional information on each of the funds evaluated in this audit.