Evaluating the Department of Commerce’s Major Economic Development Incentive Programs
Introduction
This audit satisfies requirements in K.S.A. 46-1137. The Legislative Post Audit Committee directed us to evaluate these incentives at its June 1, 2020 meeting.
Objectives, Scope, & Methodology
State law (K.S.A. 46-1137) requires us to include 3 components in our evaluations of the state’s economic development incentive programs: a description of each incentive, a literature review, and an estimate of each incentive’s economic and fiscal impacts.
Our main objective was to answer the following question:
- Do the Department of Commerce’s major economic development incentive programs generate returns on investment that equal or exceed their costs?
To answer this question, we reviewed incentive data from fiscal years 2017 through 2021 from the Departments of Commerce and Revenue. We reviewed 28 incentive projects that spanned 5 of the state’s major incentive programs. As part of the review, we used an economic model to estimate the impacts of each project. Then, we used the model results to draw conclusions about program-level performance. We consulted with economic development experts as part of our review. They advised us on the economic modeling process. We also surveyed businesses that received incentives to get their perspectives on the importance of incentives.
As required by statute, our work also included a literature review about the effectiveness of other similar incentive programs. We also identified other states with similar incentive programs.
Our scope of work did not include an evaluation of how the Department of Commerce administered the programs we evaluated. For example, we didn’t evaluate how the department negotiates incentive awards with businesses. Further, we had to make a variety of assumptions in our evaluation process, including how businesses will perform in the future. More specific details about our process and methods are included throughout the report and in Appendix B.
The results of this audit should not be compared to the results of a similar audit we did in 2014. Our 2014 audit used IMPLAN. This audit uses a different model. The results are not directly comparable. The 2 audits should not be used to draw conclusions about whether the effectiveness of the programs we evaluated have changed over time. We used a different model for this audit because we think it is better suited to the evaluation we needed to do. For example, the model we used in this evaluation estimates how much incentives affected businesses’ decisions. This model didn’t exist in 2014, so we couldn’t use it for the 2014 audit.
More specific details about the scope of our work and the methods we used are also included throughout the report as appropriate.
Important Disclosures
We conducted this performance audit in accordance with generally accepted government auditing standards. Those standards require that we plan and perform the audit to obtain sufficient, appropriate evidence to provide a reasonable basis for our findings and conclusions based on our audit objectives. Overall, we believe the evidence obtained provides a reasonable basis for our findings and conclusions based on those audit objectives.
Audit standards require us to report limitations on the reliability or validity of our evidence. In this audit, we could not fully verify the reliability of job creation and retention data businesses reported to Commerce. We compared the data businesses reported to Commerce to data businesses reported to the Department of Labor. In some cases, the 2 data sets were different, but we didn’t see evidence that businesses reported grossly unreliable information to Commerce. But because the data sets were sometimes different, we couldn’t be sure what businesses reported to Commerce was completely accurate.
Audit standards require us to report confidential or sensitive information that we had to omit or mask. In this audit, we omitted business names and information about the amounts of incentives (e.g., tax credits) individual businesses received. This was to protect businesses’ tax information, which is confidential pursuant to K.S.A. 79-3234(b).
Our audit reports and podcasts are available on our website (www.kslpa.org).
Background
Incentives Descriptions
We evaluated 5 of the Department of Commerce’s major economic development incentive programs.
- Generally, these programs are all meant to promote economic development in Kansas. They are used to incent businesses to move to Kansas, create or retain jobs, pay a higher than average wage, or make capital investments. For doing these things, businesses earn financial benefits.
- The High Performance Incentive Program (HPIP) encourages businesses to make capital investments, pay higher than average wages, and provide training to their employees. In exchange, the business is awarded Kansas tax credits and a sales tax exemption certificate.
- The Job Creation Fund (JCF) is the Department of Commerce’s deal-closing fund. It provides cash awards to businesses to support job creation. The department can also use it to support other economic development opportunities, like stopping a major employer from leaving the state.
- The Kansas Industrial Training (KIT) program reimburses businesses for training new workers.
- The Kansas Industrial Retraining (KIR) program reimburses businesses for retraining existing workers. To qualify for KIR, a business must show employees to be trained are likely to be displaced because of obsolete or inadequate job skills and knowledge.
- The Promoting Employment Across Kansas (PEAK) program encourages businesses to create new jobs. Businesses create new jobs by locating a new business facility in Kansas, relocating an existing facility to Kansas, or by expanding an existing Kansas facility. In exchange, businesses keep (or receive refunds on) 95% of state withholding taxes for those jobs. A business must pay new jobs a wage that is at or above the county median wage where the company plans to relocate.
- Appendix C summarizes these 5 programs in more detail, including the programs’ histories and goals. It also includes what businesses must do to qualify for each program.
- These programs are funded with state dollars or through foregone revenues. JCF, KIT, and KIR spend state funds to make cash payments to businesses. HPIP and PEAK reduce state tax revenues. The state accepts these costs in hopes the incentives will generate economic benefits.
The Departments of Commerce and Revenue administer the 5 incentive programs we reviewed.
- The Department of Commerce (Commerce) oversees all 5 programs we evaluated. It determines whether businesses are eligible for the programs and ensures businesses meet requirements while they’re participating in the programs.
- Commerce is solely responsible for administering JCF, KIT, and KIR. That’s because these programs involve cash awards, not tax benefits.
- The Department of Revenue (Revenue) helps administer HPIP and PEAK. That’s because those programs involve tax benefits. Commerce ensures businesses are eligible for the programs. Revenue then oversees businesses’ tax benefits. For example, Revenue processes businesses’ HPIP tax credits.
Commerce decides if and how much businesses may receive in incentives for all programs except HPIP.
- Commerce has discretion over whether businesses can participate in the JCF, KIT, KIR, or PEAK programs. Commerce decides which incentives a business will receive and the value of those incentives.
- Businesses must first enter into a formal agreement with Commerce to receive any incentives from the JCF, KIT, KIR, or PEAK programs. An agreement lays out what a business must do (e.g., number of jobs to be created, jobs trained, capital investment requirements, or wage standards), how long it has to meet its obligations, and the maximum amount of incentives it may receive in return.
- Businesses won’t necessarily receive the full incentive amounts listed in their agreements. The amount Commerce awards is the maximum a business can earn. The amount a business receives is based on the extent to which the business meets its obligations (e.g., how many jobs it creates).
- Commerce can penalize businesses that do not meet the terms of their agreements. Agreements for each program have different lengths. For example, KIT and KIR agreements last for 1 year. But PEAK agreements can last for up to 10 years. Businesses have to meet their obligations within the length of their agreement periods. If they don’t, Commerce may prorate awards or claw back funds, depending on the program. This also means that many of the agreements from the time period we reviewed (fiscal years 2017-2021) were ongoing. For example, it could be as late as 2031 before some PEAK agreements are complete.
- Unlike the other four programs, HPIP does not rely on agency discretion. HPIP also doesn’t involve any agreements. Instead, the amount of the HPIP incentives a business can receive is defined in statute. For example, under state law, a business can earn a tax credit equal to 10% of the portion of a qualifying capital investment that exceeds $50,000, or $1 million for investments in Douglas, Johnson, Sedgwick, Shawnee, or Wyandotte counties. These could include projects like expanding a manufacturing facility. Commerce is responsible for approving HPIP applications. If certified, businesses work with Revenue to receive the incentives.
A business can receive incentives from multiple programs for a single project it pursues in Kansas.
- For our purposes, a project is when a business locates, expands, or creates or retains jobs in Kansas. A project includes all incentives a business received from the 5 programs during fiscal years 2017-2021. For any 1 project, Commerce may award a business incentives from 1 program or from multiple programs. For example, Commerce awarded 1 business PEAK incentives and JCF incentives for a project involving job creation. We couldn’t quantify how often Commerce does this, but our review showed it’s fairly common for businesses to receive incentives from more than one program. Combining incentives may help Commerce incent businesses to locate, expand, or create or retain jobs in Kansas.
- A business must sign an agreement for each incentive program it participates in (except for HPIP). For example, a business participating in both PEAK and JCF will have two agreements with Commerce—one for PEAK and another for JCF.
- A business can use the same jobs to meet requirements for multiple incentive programs. For example, a business that’s required to create 100 jobs for PEAK and 100 jobs for JCF doesn’t have to create 200 total jobs. Instead, it can create 100 total jobs and earn both PEAK and JCF incentives.
In fiscal years 2017 through 2021, Commerce awarded businesses more than $400 million through PEAK, JCF, KIT, and KIR.
- As Figure 1 shows, Commerce awarded businesses about $436 million in PEAK, JCF, KIT, and KIR benefits in fiscal years 2017 through 2021. Businesses have received some of these benefits and will continue to receive them through 2031. Commerce awarded PEAK and KIT incentives most often. On average, PEAK awards were the largest and KIT awards were the smallest.
| Figure 1: Commerce awarded businesses more than $400 million in incentives in fiscal years 2017-2021. | |||
| Program | Number of Agreements | Average Award Amount | Total Dollars Awarded (a) |
| PEAK | 210 | $1.9 million | $400.4 million |
| JCF | 70 | $424,000 | $29.7 million |
| KIT | 256 | $14,000 | $3.6 million |
| KIR | 153 | $15,500 | $2.4 million |
| Total for all programs: | $436.1 million | ||
| (a) This refers to the maximum amount of incentives a business may receive over the life of its agreement. This is often different than the amount a business actually receives. According to Commerce officials, businesses had received about $114 million as of November 2022. Source: LPA analysis of Department of Commerce incentive agreement data. |
|||
| Kansas Legislative Division of Post Audit | |||
- Businesses were also awarded more than $3 billion in HPIP tax credits in tax years 2017 through 2020. We don’t include HPIP in the figure above because Commerce doesn’t award HPIP credits to businesses through agreements. Showing things like number of agreements or average award size isn’t possible. Also, businesses don’t have to use the tax credits in the year in which the credits were awarded. Businesses can use the credits they were awarded for up to 16 years in the future. But it’s not clear businesses will have enough income tax liability to use all their credits, even over 16 years. As part of our review, we saw businesses often didn’t have enough state tax liability to use all the credits they had been awarded. Therefore, businesses may or may not use the $3 billion in tax credits they were awarded.
- As Figure 2 shows, most incentive agreements were with businesses in Kansas’s most populous counties. Businesses in these counties also received the largest shares of incentive awards. For example, as the figure shows, 115 (55%) of the 210 PEAK agreements were to businesses in Johnson County. Those 115 businesses represent about $244 million (61%) of the $400 million in PEAK benefits Commerce awarded.
Methodology
We did several key things to estimate the impacts of the 5 incentive programs we reviewed.
- K.S.A. 46-1137 requires us to evaluate the state’s economic development incentive programs. The main purpose of the evaluations is to estimate the fiscal or economic impacts of the programs.
- To estimate these impacts for HPIP, JCF, KIT, KIR, and PEAK, we used a multi-step process.
- We selected 28 incentive projects to evaluate. For our purposes, a project was all the incentives a business received from the 5 programs during fiscal years 2017-2021. Some of the projects we evaluated included only 1 incentive agreement. Other projects included agreements from multiple incentive programs.
- Then, we used an economic model to estimate the impacts of each project. For example, one company brought in an out-of-state operation and expanded in Kansas. Commerce provided both JCF and PEAK incentives for this project. The model estimated the fiscal and economic impacts of that project. We compared the impacts to the costs of each project to calculate a return on investment for each project.
- Finally, we used the model results from each project to estimate the return on investment for each of five incentive programs we evaluated.
We selected 28 projects to model.
- We judgmentally selected 28 of the approximately 600 businesses that received incentives in fiscal years 2017 through 2021. We generally selected businesses with agreements from earlier years. Looking at older agreements helped ensure we’d have more data to model. We also selected businesses to get a mix of incentive programs.
- The 28 projects we selected covered a variety of programs, counties, and industries. For example:
- They included 64 agreements—23 KIT agreements, 18 PEAK, 11 JCF, and 11 KIR. 8 projects also included HPIP.
- They included projects from 12 counties. It included some urban counties and some rural counties. Most of the projects (16) we selected were in Johnson County.
- They included projects from 11 industries that ranged from things like construction services to finance and insurance services. Most projects involved businesses in the manufacturing or professional services sectors.
- Our results are based on a judgmental selection, not a projectable sample. If we had selected different projects, our results may have been different because projects differ for other reasons, too, including the number of jobs they plan to create. However, we think our selection provides useful information about the impacts of the incentive programs.
We used a research-based model to estimate the economic impacts and tax effects for the selected projects.
- We used a research-based model to evaluate the economic impacts and tax effects of each project. Dr. Timothy Bartik developed the model. Dr. Bartik is part of the non-profit W.E. Upjohn Institute for Employment Research. He’s a national expert on the impact of economic development incentives.
- Dr. Bartik’s model focuses on the jobs created by incentive projects. It uses job creation information to estimate the impacts a project has on the private sector economy and public sector tax revenues.
- Private sector economic impacts are the effects businesses cause when they create or retain jobs. These effects contribute to the state’s economy. The model we used estimates the dollar value of projects on Kansas’s economy over 20 years. Below are a few examples of private sector economic impact.
- The most direct impact of the projects is they create jobs or protect jobs at risk of elimination. This provides income to workers to spend.
- When workers spend their income or businesses make purchases, it creates demand for goods and services. This demand helps other businesses grow. Those other businesses will need to hire more employees to meet demand. Businesses also need to purchase materials and services to support their operations.
- Demand for workers can also cause population growth. For example, people may migrate into Kansas because jobs are available. Population growth may increase demand for real estate. This increases property values.
- These positive impacts are also counterbalanced by negative impacts. For example, increases in wages may be positive for workers because they get more money to spend. But it may be negative for businesses because it cuts into their profits. And increased property values may make it harder or more expensive to buy property.
- Public sector tax effects (i.e., fiscal impacts) are new tax revenues the state and local governments will collect because of the additional economic activity. These tax effects offset the costs of the incentives awarded to businesses. For example, new jobs or higher wages increase state income tax revenues. But a growing population may mean governments need to spend more to provide public services. So not all new revenues are a net gain. The model we used estimates the dollar value of the tax effects projects will produce over 20 years. It accounts for added spending by state and local governments due to a growing population.
- Adding estimated economic impacts and tax effects shows the total returns we estimate each project will produce.
- We consulted with two experts who helped us with the modeling work. We consulted with Dr. Bartik during the audit about how to best use his model. We also reviewed his user’s guide, as cited in Appendix A. We also consulted with Dr. John Leatherman about the assumptions we used in the model and to determine industry multipliers. Dr. Leatherman was previously a professor at Kansas State University. Dr. Leatherman has 38 years of experience in researching, modeling, and consulting about economic development. He was also a consultant on our prior economic development audit.
The model estimates the portion of economic impacts and tax effects for which incentives were responsible.
- The purpose of an incentive is to get a business to make a choice it otherwise wouldn’t have. For example, to build a new facility in Kansas instead of another state.
- When evaluating an incentive project, one major question is this: Would the business have done the same thing if it hadn’t received the incentives? If the business would have done the same thing, then the incentive was unnecessary. But if the business wouldn’t have done the same thing, the incentive affected the business’s decision. That would mean the incentive was responsible for the economic impacts and tax effects generated by the business.
- However, we don’t know how much incentives influenced businesses’ decisions. There are many factors that can influence a business’s decision such as the cost of labor and local infrastructure. In the absence of that information, the model estimates the likelihood incentives affected a business’s decision. This likelihood is called the but for percentage.
- The model estimates the but for percentage by comparing the value of the incentive to the project’s total value. The bigger an incentive is relative to the value of a project, the bigger the but for percentage. For example, Commerce awarded 1 business $3.2 million to create 500 jobs. The model calculated the value of the project to be about $851.9 million over 20 years. After comparing those 2 values, the model determined the but for percentage was about 2.9%.
- The model multiplies the but for percentage by the number of jobs a project will create. It uses this information to estimate the economic impacts and tax effects those jobs will generate. Those economic impacts and tax effects are the benefits for which incentives are responsible. They’re the benefits we discuss throughout the rest of the report. For example, the model assumes 2.9% of the aforementioned business’s 500 jobs, or about 15 jobs, were created because of the incentive. The but for percentages for the 28 projects we reviewed ranged from 0.14% to 31.1%.
We calculated a return on investment for each project.
- Each incentive project we reviewed has a cost to the state. The state is either forgoing tax revenues (for HPIP and PEAK) or using revenues to pay for incentives (for JCF, KIT, and KIR).
- We compared each project’s cost to its economic impacts and tax effects to calculate returns on investment. We calculated each project’s return on investment as returns per $1 of incentive received. Return on investment shows how much benefit the state got per $1 of cost. A return greater than $1 means a project was successful because it caused more in benefits than it cost the state.
- We also calculated how much economic impact every $1 of incentives caused (economic impact returns) and how much tax effects every $1 of incentives caused (tax effect returns).
- The returns we calculated are indicators of program success. But they are not absolute values. We think our estimates are based on reasonable assumptions and methodologies. But our estimates may vary from what will happen. Readers should focus on whether programs seem likely to have returns of above or below $1. Readers should not focus on the exact returns we estimated.
- Our estimates are also not based on a projectable sample of projects. Our estimates may therefore not generalize to projects we didn’t evaluate. For example, not all projects will necessarily generate total returns greater than $1.
We used the results from the 28 projects we modeled as indicators of how well the programs we evaluated perform.
- We attributed the costs (i.e., the incentive amount) and benefits (i.e., economic impacts and tax effect returns) of each project to each incentive program. We did this based on how much of the total award each incentive program represented. For example, if a business was awarded $1 million in incentives—$800,000 from PEAK and $200,000 from JCF, we attributed 80% of the economic impacts and tax effects to PEAK and 20% to JCF. We had to do this because some of the projects we modeled included awards from multiple programs.
- We then added together all the costs and benefits we attributed to each program. This let us calculate a return on investment for each program.
We estimated Commerce’s major economic development incentive programs will generate positive total returns, but they don’t cover their own costs to the state through higher tax revenues.
Program-Level Findings
All 5 incentive programs appear to yield positive total returns.
- Total returns are made up of the programs’ economic impact returns combined with tax effect returns.
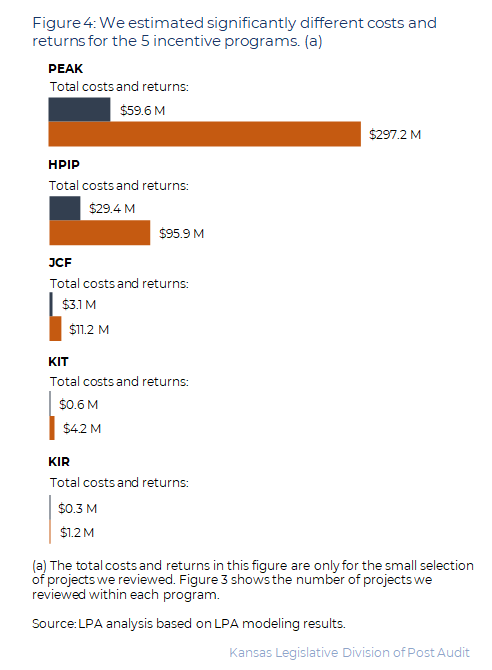
- As Figure 3 shows, we estimated all 5 incentive programs will generate total returns of more than $1.
| Figure 3: All incentive programs appear to generate more than $1 in total returns per $1 of incentive costs (all values in 2020 dollars and estimated over 20 years). | ||||
| Program | # of projects we reviewed (a) | Estimated total incentive costs | Estimated total returns | Estimated total returns per $1 of incentive costs (b) |
| KIT | 10 | $0.6 million | $4.2 million | $7.24 |
| PEAK | 18 | $59.6 million | $297.2 million | $4.99 |
| KIR | 9 | $0.3 million | $1.2 million | $3.71 |
| JCF | 10 | $3.1 million | $11.2 million | $3.63 |
| HPIP | 8 | $29.4 million | $95.9 million | $3.26 |
| (a) The number of projects we reviewed doesn’t equal the number of agreements we reviewed. That’s because some projects included more than 1 agreement from the same program. For example, 1 project included 3 separate KIT agreements. (b) Returns in figures 5 and 6 won’t add to the returns here due to rounding. Source: LPA analysis based on LPA modeling results. |
||||
| Kansas Legislative Division of Post Audit | ||||
- Our estimates suggest the incentive programs are generally successful. Most of the benefits of each program come from economic impacts. Since the purpose of these programs is to promote economic growth, these programs seem successful.
- Our results are not an evaluation of which programs are most effective. As we discussed earlier, the returns we estimated are not absolute values. They are indicators of program success. There are a few reasons to not compare programs to each other:
- The programs are different sizes. We estimated KIT created the largest return on investment. However, as shown in Figure 1, KIT is a small program from which Commerce makes small awards. And as Figure 4 shows, KIT’s total returns for the projects we modeled are small. By contrast, PEAK is a large program that generates significant total returns for the projects we modeled. PEAK’s return on investment is smaller than KIT’s, but PEAK generates more total value for the state.
- Our assumptions may not fit all programs equally. For example, for KIR, a business enters into a 12-month agreement with Commerce. The business is then required to train staff within that 1-year window. Businesses may not retain positions incented by KIR for 20 years like our current assumptions predict. We tested what would happen if we had instead assumed businesses retain KIR jobs for only 5 years. Under that assumption, the total returns for KIR would be lower, but still greater than $1.
- Finally, we’re likely underestimating both the costs and returns associated with HPIP. That’s because we didn’t include the HPIP sales tax exemption in our modeling work. KDOR estimates the amount of foregone sales tax revenue, but no one knows the true amount foregone because businesses aren’t required to report how much in sales taxes they were actually exempted from. Our modeling work also doesn’t account for the possible short-term impacts of businesses’ capital investments (e.g., economic benefits from paying a construction firm to build a new building).
- Total returns are made up of the programs’ economic impact returns combined with tax effect returns. In the next 2 sections, we talk about the programs’ economic impacts and tax effects separately and what they say about the programs.
All 5 incentive programs we evaluated appear to generate economic impacts that are greater than their costs.
- Economic impacts reflect things like the value of new jobs, higher pay, more spending, and higher real estate values. These things generally benefit the state’s residents and businesses.
- As Figure 5 shows, we estimated all 5 incentive programs we evaluated will generate more than $1 of economic impacts per $1 of incentive costs. This shows the incentive programs are generally successful and incenting economic development.
- The figure also shows economic impact returns account for most of the programs’ total returns on investment. For example, we estimated PEAK’s total return is about $4.99. Of that, $4.54 (91%) is from economic impact returns.
| Figure 5: All incentive programs appear to generate more than $1 in economic impacts per $1 of incentive costs (all values in 2020 dollars and estimated over 20 years). | ||||
| Program | # of projects we reviewed | Estimated total incentive costs | Estimated total economic impacts | Estimated total economic impacts per $1 of incentive costs |
| KIT | 10 | $0.6 million | $3.7 million | $6.52 |
| PEAK | 18 | $59.6 million | $270.3 million | $4.54 |
| KIR | 9 | $0.3 million | $1.0 million | $3.12 |
| JCF | 10 | $3.1 million | $9.6 million | $3.11 |
| HPIP | 8 | $29.4 million | $85.7 million | $2.91 |
| Source: LPA analysis based on LPA modeling results. | ||||
| Kansas Legislative Division of Post Audit | ||||
None of the programs appear to generate enough tax effects to cover their costs.
- Tax effects reflect things like higher worker wages increasing income tax revenues. Tax effects also reflect increased sales and property tax revenues due to more spending and higher real estate values. Tax effects include effects on both state and local taxes.
- Incentives are expenditures of state funds or foregone tax revenues. Estimating the programs’ changes to future tax revenues helps determine whether incentive programs cover their costs to the state.
- As Figure 6 shows, we estimated none of the incentive programs will return more than $1 in tax effect returns per $1 of incentive costs.
| Figure 6: No incentive program appears to cover its own costs through tax effects (all values in 2020 dollars and estimated over 20 years). | ||||
| Program | # of projects we reviewed | Estimated total incentive costs | Estimated total tax effects | Estimated tax effects per $1 of incentive costs |
| KIT | 10 | $0.6 million | $0.4 million | $0.71 |
| KIR | 9 | $0.3 million | $0.2 million | $0.59 |
| JCF | 10 | $3.1 million | $1.6 million | $0.52 |
| PEAK | 18 | $59.6 million | $26.9 million | $0.45 |
| HPIP | 8 | $29.4 million | $10.2 million | $0.35 |
| Source: LPA analysis based on LPA modeling results. | ||||
| Kansas Legislative Division of Post Audit | ||||
- These results show the incentive programs don’t likely cover their own costs in terms of state tax effects. In other words, the future tax effects likely won’t fully cover the state monies awarded as incentives for these programs.
Project-Level Findings
We estimated 23 of the 28 projects we modeled will yield positive total returns.
- We estimated 23 projects will generate positive total returns. Appendix D shows the economic impact and tax effect returns for each of the projects we modeled. As the appendix shows, we estimated 22 projects will generate positive returns based on economic impacts alone. For these 22 projects, economic impacts ranged from $1.07 to $7.57 per $1 of incentive costs. Adding in tax effect returns makes 1 other project’s total returns greater than $1.
- This means 5 projects had total returns of less than $1 per $1 of incentive costs, which suggests these projects were unsuccessful.
- Also, we estimated 6 projects will generate less than $1 of economic impacts per $1 of incentive costs. These projects either failed or created fewer jobs than planned.
- Finally, we estimated none of the projects will cover their own costs through tax effect returns. Tax effect returns ranged from $0.28 to $0.52 per $1 of incentive costs.
Our assumptions and methodological choices influenced the results of our modeling.
- The model we used includes many baseline assumptions and inputs provided by Dr. Bartik. Some are specific to Kansas. Others are based on economics research (e.g., how businesses respond to things like state and local business taxes and incentives). We generally did not adjust them.
- But we did adjust some specific assumptions and inputs to better reflect the projects we evaluated. Below, we discuss some of the most important aspects of our modeling work. We discuss our methods in more detail in Appendix B.
- We used businesses’ projections to determine how many jobs businesses planned to create. We also used data businesses reported to Commerce to determine how many jobs businesses actually created. We adjusted what businesses reported based on comparisons to Kansas Department of Labor (KDOL) data (businesses report employment data to KDOL). But there were limitations on how precise our work could be. We cannot guarantee the accuracy of what businesses reported.
- When projects were incomplete, we estimated what would happen in the future. If we underestimated the jobs businesses will create or retain, then the estimated returns in this report are low. If we overestimated jobs, then the estimated returns are high.
- We modeled project impacts over 20 years. We thought 20 years was a relevant timeframe for policymakers to consider. We generally assumed jobs created or retained would stay around for the full period we modeled. If jobs don’t stay that long, then the model would overestimate the returns.
- We also made some methodological choices that may have affected our results.
- When 1 project received incentives from multiple programs, we divided costs and benefits between programs based on the percentage of the total award each incentive represented.
- We only modeled the impacts of the 5 incentive programs we evaluated. It’s possible businesses received (or will receive in the future) other incentives. We did not model or otherwise account for these other incentives. For example, businesses may have received incentives from local governments for which we didn’t account. It’s not clear how the inclusion of other possible incentives would affect our results.
- Finally, things like COVID-19 and ongoing economic circumstances may have affected our estimates. For example, COVID may have caused businesses to perform differently than they otherwise would have. Our estimates also don’t account for ongoing economic issues like high inflation.
Business Survey Results
We surveyed businesses to get direct insight about the importance of incentives.
- Economic development incentive evaluations are often based on assumptions. Evaluators must speculate what motivates businesses to make decisions. They must estimate how important incentives are based on assumptions like those we made in this evaluation. We thought asking businesses about incentives would provide valuable insight into whether our assumptions and methodologies make sense.
- We asked 298 businesses that received incentives to participate, but only 55 responded. These 55 businesses benefitted from at least 1 of the incentive programs we evaluated in fiscal year 2021. We asked the businesses about the importance of various factors to their business plans.
- We asked respondents about how important various factors were to their decisions to commit to a project in Kansas. For example, we asked how important things like economic development incentives and the cost of labor were.
- Of the 55 businesses who participated, 30 provided complete responses to our survey for a response rate of 55%. Our survey results aren’t projectable. However, we think they provide valuable insight into how incentives affect at least some businesses’ decisions.
- The survey results aren’t representative of all businesses. We only surveyed businesses that received incentives and were willing to participate in our survey. Those businesses may have different perspectives on the value of incentives. Businesses that didn’t receive incentives may have different perspectives.
Many respondents told us economic development incentives affected the size and timing of their projects, but didn’t change whether the projects would have happened.
- We asked respondents what their businesses would have done if they hadn’t received Commerce incentives.
- 16 respondents (53% of the 30 who provided complete responses) said their businesses would have done something different if they hadn’t received incentives. But only 1 said they would have canceled the project.
- 10 respondents said their businesses would have still done their projects in Kansas. But they said the projects would have been on a smaller scale.
- 3 said their businesses would have done their projects later.
- 2 said their businesses would have done their projects in another state.
- 1 said their business would have canceled its project in Kansas.
- 11 respondents (37%) said their businesses would have proceeded with their projects as planned, even without the incentive. In other words, Commerce’s incentive awards didn’t affect these businesses’ decisions. This suggests incentive awards aren’t always responsible for economic or fiscal benefits.
- 3 respondents (10%) provided free responses about what their businesses would have done. Based on their responses, it seems like incentives were important to their businesses’ decisions to locate in Kansas. But it wasn’t clear what these businesses would have done in the absence of incentives.
- These results show incentives may impact the size, timing, and location of businesses’ projects. Only 3 of our respondents said their businesses wouldn’t have done their projects in Kansas without incentives. By contrast, 11 respondents told us their businesses would have proceeded with their projects as planned, even without any economic development incentives. This shows incentives aren’t always responsible for all benefits associated with economic development projects.
Survey respondents also told us other factors were important to their businesses’ decisions.
- We asked respondents to rank-order how important 9 factors were to their businesses’ location decisions. Factors included things like skilled workforce availability, incentives, and business tax rates.
- While each respondent rated the factors differently, on average, 4 were most important: skilled workforce availability, quality infrastructure, economic development incentives, and cost of labor. These factors were all rated as roughly equally important.
- Respondents generally ranked the other 5 factors as less important. Those factors were availability of local suppliers, whether the business had other sites in Kansas, quality of life, whether the business’s industry had a significant presence in Kansas, and state business tax rates.
- This shows businesses consider factors aside from incentives when making decisions. Incentives may play a role in businesses’ decisions, but other factors, such as the quality and cost of labor, are also important. It’s also possible businesses we didn’t survey, including businesses that haven’t received incentives, may have different perspectives about how important these factors are.
Literature Review
Literature on the effectiveness of tax and cash award incentives is inconclusive, but it found job training programs have positive effects.
- We put the 5 incentives we evaluated into categories. We categorized HPIP and PEAK as tax incentives. We categorized KIT and KIR as job training incentives. And we categorized JCF as a cash award incentive. We reviewed literature about these types of incentives. This was to understand how effective they are. We focused on whether incentives had positive economic impacts and tax returns. We cited the literature we reviewed in Appendix A.
- Based on our research, the effectiveness of tax incentives like PEAK and HPIP is unclear. Studies found tax incentives either have mixed or no effects on job creation and capital investments. Some studies didn’t include clear conclusions about incentive effectiveness. For example, 3 studies we reviewed didn’t include return on investment calculations.
- The effectiveness of cash award incentives like JCF is also unclear. We found only a few studies looking at cash awards, and those studies found mixed effects. For example, a study from Florida found a deal closing fund benefitted the state’s economy. But it didn’t cover its own costs.
- Studies generally found job training incentives like KIT and KIR had positive effects. For example, a Virginia study found 2 programs had small positive returns. The Virginia study also included a survey that found grants often didn’t affect businesses’ plans.
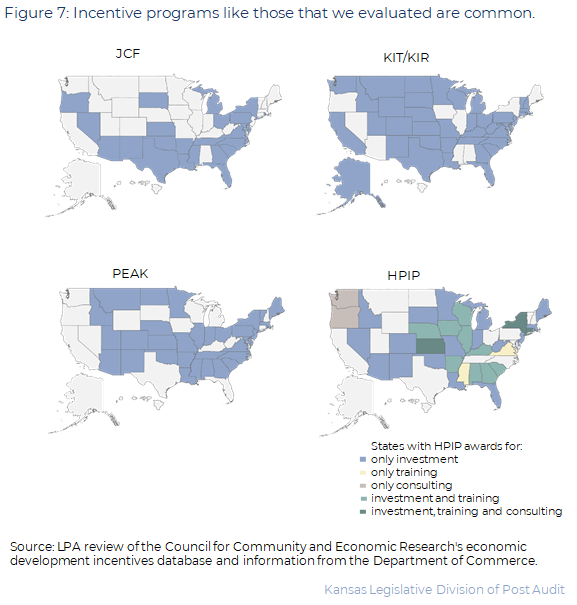
Many other states have incentive programs like the 5 we evaluated.
- Other states with programs like the 5 we evaluated for Kansas are shown in Figure 7. As the figure shows:
- 23 states had programs that were like JCF.
- 30 states had programs that were like the HPIP capital investment tax credit or sales tax exemption. 13 states had programs that were like the HPIP training expenditure tax credit.
- 32 states had programs that were like PEAK.
- 39 states had programs like KIT or KIR.
- Other states’ programs aren’t identical to Kansas’s programs. There’s also no comprehensive database of all states’ incentive programs, so we may have missed some.
Other Findings
The Owner’s PEAK tax credit program has never been used.
- We originally set out to evaluate 6 incentive programs. The 6th program was the Owner’s PEAK tax credit. It’s not included in our evaluation because no one has claimed the credit so there’s nothing to evaluate.
- The Legislature created the Owner’s PEAK tax credit in 2011. Since then, it hasn’t changed significantly.
- According to K.S.A. 79-32,266, Kansas residents who own businesses participating in PEAK may earn the Owner’s PEAK tax credit. This credit is only for businesses that have relocated to Kansas.
- A qualifying business owner can claim a tax credit equal to 95% of the business’ Kansas income tax liability. The business owner must work for the business to claim the credit.
- According to the Department of Revenue, no one has ever claimed this tax credit. Neither Revenue nor Commerce officials had recommendations on how to make the credit more accessible. It’s not clear why no one has claimed the credit. We identified several possible explanations.
- According to Commerce and Revenue officials, changes to tax law may have made the credit irrelevant. In tax years 2013 through 2016, some business income was exempt from state taxes. This tax-exempt business income was the same type of income for which taxpayers would have claimed Owner’s PEAK tax credits. But because the income was tax-exempt, they couldn’t claim credits on it.
- According to Revenue officials, business owners could also be employees of their businesses. These businesses may prefer to claim PEAK benefits on their owners as employees.
- Businesses may choose to file taxes as C Corporations. C Corporations don’t qualify for the Owner’s PEAK tax credit.
State law established a fund for Commerce to pay for certain HPIP-related services, but it has never been funded.
- K.S.A. 74-50,133 created a fund for Commerce to use to help businesses pay for assistance or consulting services. That fund is the high performance incentive fund. The Legislature created this fund in 1993.
- Under state law, Commerce could use the fund to pay for up to 50% of costs for HPIP-qualified businesses to receive business assistance and consulting services.
- According to Commerce officials, the Legislature has never appropriated money for this fund. It has not been used.
Conclusion
We did not draw any conclusions beyond the findings already presented in the audit.
Recommendations
We did not make any recommendations for this audit.
Agency Response
On November 14, 2022 we provided the draft audit report to the Department of Commerce and the Department of Revenue. Both departments provided feedback. We made minor changes based on this feedback. The Department of Commerce also chose to respond to the audit. Its response is below. In its response, Commerce disagreed with our use of Dr. Bartik’s model and questioned some of our methodologies. We reviewed their concerns but chose not to make additional changes for the reasons described below.
- Commerce contends our use of Dr. Bartik’s model is problematic because it’s different from the IMPLAN model we used in a prior 2014 audit, which makes comparisons between the results of the 2 audits inappropriate. It is true the model we used in this report is different than the one used in our 2014 audit. And as stated in the report, we agree that readers should not make comparisons. We stand by our use of Dr. Bartik’s model. We think it’s an appropriate model because it accounts for many kinds of economic impacts, such as how changes in employment affect things like property values, people migrating to Kansas from other states in search of jobs, and costs of public services. We chose to use Dr. Bartik’s model because it does these things and also estimates but for percentages, which we think is an essential component of any analysis. To our knowledge, other models do not do this unless the user modifies it to do so. Dr. Bartik’s model did not exist in 2014 for us to use it. Finally, our objective was not to do a longitudinal evaluation of the incentive programs. Even if we had used the same model as in 2014, we don’t think comparing results from 2014 would have been appropriate. That’s because circumstances today are different. For example, the 2014 audit included 2 programs that no longer exist (KEIOF and IMPACT). JCF was also a new program at that time.
- Commerce contends Dr. Bartik’s model doesn’t adequately account for Kansas-specific data. Dr. Bartik’s model allows users to select the state in which they are modeling projects. The model then automatically uses state-specific data, such as pre-existing unemployment rates, wage rates, and housing prices. It also uses Kansas-specific tax information. There may be other models that account for Kansas-specific data in greater detail than Dr. Bartik’s model. But we think Dr. Bartik’s model uses enough Kansas-specific data to make reasonable estimates of the effects of the projects we modeled.
- Commerce questioned the appropriateness of the but for percentages we estimated with Dr. Bartik’s model. We agree it’s difficult to determine the extent to which incentives influence businesses’ decisions. But we think it’s crucial to try to do so. This is part of the reason we used Dr. Bartik’s model: it estimated a but for percentage (i.e., the portion of a project’s benefits that were due to incentives) for each project we modeled. The but for percentages in this audit generally align with academic literature. For example, according to a paper by Dr. Bartik, plausible but for percentages range between about 2% and 25%. His conclusion was based on a review of 30 studies that estimated but for percentages. The but for percentages in this audit ranged between about 0.1% and 31.1%. The average but for percentage was about 5.6%.
- Commerce contends Dr. Bartik’s model doesn’t account for the short-term impacts of businesses’ capital investments and that not accounting for these things negatively skews our return-on-investment estimates. It’s true Dr. Bartik’s model doesn’t account for the short-term impacts of capital investment. But we don’t think accounting for capital investment would significantly change our conclusions. Based on work we did in our 2014 audit, jobs generated almost 10 times as much economic activity as capital investments. This is because capital investments are a one-time event that, as Commerce notes, have only short-term impacts. Jobs have an ongoing impact, so we think focusing on the impacts of job creation and retention captures the bulk of the economic and tax effects.
- Commerce presented results from another model and contends Dr. Bartik’s model undervalues return on investment compared to the other model. We had limited time to review the results from the WSU IMPLAN model Commerce cited so we can’t explain all the reasons the results are different. But, at a minimum, the model Commerce cites does not account for but for percentages. In other words, the results Commerce cites assume all project benefits happened because of incentives. This is not consistent with the academic literature we reviewed or our survey results.
- Commerce contends our process for selecting projects to evaluate limits the extent to which findings can be generalized and that a randomized selection process would have been preferable. We agree our findings are not statistically projectable. But we still think our selection provides reasonable insights about how the incentive programs we evaluated perform. We used a judgmental selection process, which is not arbitrary. We purposefully selected projects to get a reasonable mix of the many combinations of incentive awards businesses received. This was so we could review enough projects within each program to say something about overall program performance. A randomized selection process would have required us to consider many factors, such as incentive combinations, business location, and incentive size. A randomized selection likely would have required us to evaluate many more projects and would have taken much more time.
- Commerce contends our survey is too small to draw broad conclusions and that it’s unclear whether our survey respondents were decisionmakers within the businesses we surveyed. We agree our survey results are not statistically projectable. In the body of the report, we say the results aren’t projectable and acknowledge the responses may be biased. We do not think it’s appropriate for readers to draw broad conclusions about the population of all businesses based on the results. However, survey responses indicate that incentives did not influence at least some businesses’ location decisions. According to some businesses that responded, incentives didn’t play a role in their decisions to commit to projects in Kansas. Finally, Commerce provided us contact information for their points of contact within the businesses we surveyed. We asked these points of contact to tell us who in their businesses would be most knowledgeable about the decisions related to projects in Kansas. The contact person the businesses identified responded to the survey.
Department of Commerce Response
Appendix A – Cited References
This appendix lists the major publications we relied on for this report.
References Related to Bartik’s Model
- Bartik Benefit/Cost Model of Business Incentives: A User’s Guide. (February, 2022). Timothy J. Bartik.
- “But For” Percentages for Economic Development Incentives: What Percentage Estimates are Plausible Based on the Research Literature? (July, 2018). Timothy J. Bartik.
References Related to Tax Incentives
- 2020 Indiana Tax Incentive Review. (October, 2020). Office of Fiscal and Management Analysis, Indiana Legislature.
- Economic Development Tax Incentives Evaluation Act: Evaluation of New Qualified Jobs Incentive Act 2015. (March, 2021). State of Rhode Island Department of Revenue.
- Florida Economic Development Program Evaluations – Year 7. (December, 2019). Florida Office of Program Policy Analysis and Government Accountability.
- Louisiana Quality Jobs Program Tax Incentive Evaluation. (March, 2020). Louisiana Legislative Auditor.
- Nebraska Advantage Act: Performance on Selected Metrics. (April, 2019). Nebraska Legislative Audit Office.
- Review of Income and Financial Institutions Tax Credits. (March, 2021). Office of the Hawai’i State Auditor.
- State Business Tax Incentives: Examining Evidence of their Effectiveness. (December 2009). New England Public Policy Center.
- Tax Expenditures Compilation Report. (September, 2020). Colorado Office of the State Auditor.
- The Effectiveness of Job Creation Tax Credits. (August, 2021). Shiferaw Gurmu, David L. Sjoquist, & Laura Wheeler.
- The Effectiveness of Tax Incentives for Capital Investment. (Fall, 1980). Kenneth N. Matziorinis.
- The Iowa New Jobs Tax Credit: Tax Credits Program Evaluation Study. (December, 2020). Iowa Department of Revenue.
- The Role of Tax Incentives on Business Location and Economic Growth. (May, 2021). Sadie Xi Rose Mazzola.
References Related to Cash Awards
- Bringing Jobs to People: Improving Local Economic Development Policies. (August, 2020). Timothy J. Bartik.
- Do Business Subsidies Lead to Increased Economic Activity? Evidence from Arkansas’s Quick Action Closing Fund. (2017). Jacob Bundrick & Thomas Snyder.
- Economic Evaluation for Select State Economic Development Incentive Programs. (January, 2020). Florida Office of Economic & Demographic Research.
- Incentivizing Economic Development: An Empirical Examination of the Use of Grants and Loans. (Spring, 2011). Robert T. Greenbaum & Daniele Bondonio.
- State of Oklahoma Incentive Evaluation Commission: Quick Action Closing Fund Evaluation. (November, 2018). PFM Group Consulting LLC.
References Related to Job Training Incentives
- Business Incentives and Employment: What Incentives Work and Where? (November, 2008). William H. Hoyt, Christopher Jepsen, & Kenneth R. Troske.
- Economic Evaluation of CareerSource Florida’s Training Programs. (December, 2018). Florida Office of Economic & Demographic Research.
- Evidence about the Effectiveness of Public Training Programs for Incumbent Workers. (April, 2007). Kevin Hollenbeck & Sarah M. Klerk.
- Is There a Role for Public Support of Incumbent Worker On-the-Job Training? (January, 2008). Kevin Hollenbeck.
- Is Wyoming’s Workforce Development Training Fund Helping the State Retain Labor? (2005). Wyoming Department of Employment, Research, & Planning.
- State of Oklahoma Incentive Evaluation Commission: Training for Industry Program Evaluation. (November, 2019). PFM Group Consulting LLC.
- The Annual Tax Expenditure Report Including the Economic Development Programs and Tax Incentives Evaluation. (January, 2020). Mississippi Institutions of Higher Learning University Research Center.
- Workforce and Small Business Incentives. (July, 2018). Virginia Joint Legislative Audit and Review Commission.
Appendix B – Modeling Methodology
This appendix further details our modeling methodology for the 28 selected incentive projects. It includes how we used the model. It also includes information about assumptions or adjustments we made.
- As discussed in the report, the model we used includes many baseline assumptions and inputs provided by Dr. Bartik. Some are specific to Kansas. Others are research-based. We generally did not adjust them.
- Below, we discuss our methodology in further detail. This includes any adjustments we made to the model’s default assumptions and inputs.
- We used businesses’ self-reported job projections to determine when and how many jobs businesses planned to create or retain in each project. We needed information about what businesses planned to do to calculate the but for percentages for each project. It made most sense to use plans to calculate the but for percentage. That’s because businesses don’t know what will happen when they decide to commit to a project. They only know what they expect will happen. Using different data would yield different percentages for each project. Some would likely be higher, others would likely be lower.
- We used program-specific report data (e.g., data from quarterly reports required for the PEAK program) to determine the jobs businesses actually created or retained. We also used this data to determine the incentives businesses actually received. This data was relevant to calculating the costs and benefits of each project. Businesses reported the jobs they created to Commerce. We compared that to what businesses reported to the Kansas Department of Labor (KDOL). KDOL collects data about businesses’ employment levels as part of managing unemployment insurance. Commerce officials told us they also use KDOL data to verify businesses’ reported employment levels. We used the KDOL data to make adjustments to avoid doing things like double-counting jobs. But we cannot guarantee the accuracy of what businesses reported.
- When projects were incomplete, we used performance data to date to estimate what would happen in the future. For example, if a business appeared to be on track adding jobs and receiving incentives, then we assumed the business would continue to stay on track (i.e., that it would create all promised jobs and receive all promised incentives). If we underestimated the jobs businesses will actually create or retain, then we underestimated returns. And if we overestimated jobs, then we overestimated returns.
- We assumed businesses would keep the jobs they created or retained for 20 years. This was because it wasn’t clear whether or when jobs might disappear. Some will likely exist for many years, but others may not. If businesses don’t keep all jobs for 20 years, then we overestimated the benefits of the projects we modeled.
- We assumed all businesses we evaluated were 100% export-based. This was because most of the businesses we evaluated were in export-based industries. This likely means we overestimated benefits for some of the projects we evaluated. This is especially true for businesses not in export-based industries. That’s because creating jobs in non-export-based industries may displace existing jobs in the same industry. Displacing existing jobs is harmful to the economy.
- We assumed the state financed incentives through tax increases instead of spending cuts. We didn’t have evidence the state funds the programs we evaluated through spending cuts. If we had assumed the state financed incentives at least in part through spending cuts, it would have reduced the estimated returns. That’s because the model assumes spending cuts negatively affect education. And that reduces workers’ future wages. This assumption may also mean we overestimated tax effect returns.
- We used value-added information calculated by the model based on businesses’ industries rather than based on actual wages. This is what Dr. Bartik advised. He said we should only use actual wages in special cases where businesses pay their workers unusually high wages for their industries.
- Our consultant, Dr. Leatherman, used IMPLAN to calculate multipliers for each project we modeled. IMPLAN is a piece of economic modeling software. Multipliers estimate how many additional jobs each new job will lead to, based on a business’s industry and location.
- Methodological choices we made may have affected our results.
- We reported all results in 2020 dollars for consistency.
- We reduced the number of years the model projects from 80 years to 20 years. We thought 20 years was a more useful timeframe for policymakers to consider. It also limited our need to make assumptions about what happens in the extreme long run (e.g., whether businesses keep incented jobs for 80 years).
- When we evaluated multiple incentives in 1 model, we calculated the benefits attributable to each incentive based on the percentage of the total award each incentive represented. We did this after adjusting incentive awards to their present value. That is, to account for money being less valuable in later years than in earlier years. We wanted to give greater weight to incentives businesses got (or will get) sooner than to incentives that businesses will get later.
- We allocated incentive costs based on a 5% annual discount rate. This was to reflect the state’s perspective on the cost of incentives. That’s because the state government bears the cost of incentives. Dr. Bartik’s model uses a 3% social discount rate and a 2% rate of inflation. We used the same figures, thus the 5% annual discount rate.
- We allocated the benefits of incentive projects based on a 14% annual discount rate. This was to reflect businesses’ perspectives on the value of incentives. That’s because businesses’ responses to getting incentives is what produces benefits. Dr. Bartik’s model uses a 12% discount rate for businesses. This is based on research that firms focus on short-term profits and stock prices. The model also uses a 2% rate of inflation. Thus, we used a 14% annual discount rate.
- We didn’t count job losses below baseline levels against incentive awards. For example, say a business started an incentive project with 100 jobs and planned to add 100 more. If the business instead lost 50 jobs, we wouldn’t say the incentive caused the business to lose 50 jobs. We’d simply say the incentive wasn’t associated with any new jobs. That’s because we didn’t think it made sense to say incentives could cause job losses.
- We only modeled the impacts of the 5 incentive programs we evaluated. It’s possible businesses received (or will receive in the future) other incentives we did not model or otherwise account for. It’s not clear how the inclusion of other possible incentives would affect our results.
- We made some other assumptions and methodological choices specific to HPIP. Here, we discuss those things in more detail.
- We counted only HPIP tax credits earned in the years we evaluated that we could also associate with job creation numbers, either from other incentives awarded at the same time or based on data reported by businesses to the Department of Revenue. We did not count HPIP tax credits earned in prior years and carried forward to the period we evaluated. That’s because businesses earned those credits as part of projects outside of our evaluation period.
- We also generally did not include HPIP credits earned in tax year 2021 in our modeling work. That’s because, at the time of our analysis, many businesses had not submitted HPIP documentation to Revenue. If businesses claim HPIP credits in tax year 2021, then our modeling work underestimates the costs of the HPIP projects we reviewed. This could mean we’re also underestimating but for percentages for these projects, too. Both of these factors would change our return on investment estimates.
- If a business was carrying forward credits from prior years and earned new credits relevant to our analysis, we assumed the business used only a portion of its newly earned credits in the year it earned them. That’s because we thought it made sense for a business to prefer using older credits to using newer credits they could carry forward for longer.
- We assumed businesses would use up all credits they earned within 16 years. We allocated unused credit amounts equally across however many years remained in businesses’ 16-year carry-forward periods. If businesses plan to use their credits faster, it may mean we underestimated the but for percentages. It would also increase the cost to the state. That’s because the model considers $1 to be worth less as years progress. It’s also possible businesses won’t use all the credits they earned. This would decrease the but for percentages and the cost to the state.
- We did not include the HPIP sales tax exemption in our analysis. Revenue estimates foregone sales tax revenues based on businesses’ applications for HPIP sales tax exemptions. We elected not to use the estimated exemption data. This means we’re likely underestimating but for percentages and incentive costs on any projects where businesses benefited from the HPIP sales tax credit.
Appendix C – Economic Development Incentive Program Details
This appendix further details the 5 programs we evaluated.
High Performance Incentive Program
- Program Description: The High Performance Incentive Program (HPIP) provides businesses 3 potential tax benefits:
- A Kansas tax credit equal to 10% of a qualifying capital investment. The investment must exceed $50,000 for nonmetropolitan counties or $1 million in metropolitan counties. If a business doesn’t use all the credits it earned in 1 year, it can carry forward unused credits for up to 16 years. But a business also has to have Commerce recertify its business facility in any year it wants to use credits it carried forward.
- A sales tax exemption on materials or services needed for capital investment projects.
- A Kansas tax credit that matches businesses’ employee training and education expenditures. A business’s spending must exceed 2% of its payroll at a specific worksite to earn this credit. State law caps the credit at $50,000. A business must also use the credit in the year the business earns it.
- Statutory Goals: Statute doesn’t identify the goals of or intent behind HPIP. But based on how it works, HPIP appears to encourage businesses to make capital investments, pay higher than average wages, and train their employees.
- Qualifying Criteria: To qualify for HPIP, businesses must meet certain criteria. A business must:
- Be for-profit.
- Be subject to state income, sales, or property taxes.
- Be in a qualifying industry, such as manufacturing. A business can also qualify for other reasons, like being a corporate headquarters. Businesses in some industries must get at least 51% of gross revenues from sales to Kansas manufacturers or out-of-state customers.
- Pay above average wages relative to businesses in similar industries in the area OR be the only business in the industry in the area.
- Program History: The Legislature established HPIP in 1993. Since then, the program has changed in several ways. Key changes include the following:
- In 2000, the Secretary of Commerce became responsible for determining businesses’ HPIP eligibility.
- In 2011, the carry forward period for unused capital investment tax credits increased to 16 years. Previously, businesses could only carry credits for up to 10 years. The Legislature also added the sales tax exemption component to HPIP.
- In 2021, businesses were no longer required to take part in KIT, KIR, or the Lifelong Learning Program to earn capital investment tax credits. Participation is still required to earn sales tax credits. Taxpayers were also allowed to transfer up to 50% of their capital investment tax credits in a single tax year for projects placed into service after January 1, 2021.
Job Creation Fund
- Program Description: The Job Creation Fund (JCF) is Commerce’s deal-closing fund. Commerce uses the JCF to help secure economic development opportunities for the state. Businesses receive either up-front forgivable loans or grant payments upon hitting agreed-upon goals.
- Statutory Goals: According to K.S.A. 74-50,224, the JCF should promote job creation and economic development in Kansas.
- Qualifying Criteria: Commerce has significant discretion in deciding how to use the JCF. Businesses don’t have to meet specific criteria to receive awards.
- Program History: The Legislature created the JCF in 2011. It combined the IMPACT program and Kansas Economic Opportunity Fund (KEOIF). The program hasn’t significantly changed since the Legislature created it. In past years, the Legislature had limited funds credited to the JCF to $3.5 million per year. In the 2022 session, the Legislature increased that limit to $8.5 million for fiscal year 2022 and $20 million for fiscal years 2023 and 2024.
Kansas Industrial Training & Retraining Programs
- Program Description: The Kansas Industrial Training (KIT) program reimburses businesses for creating new jobs and training new employees for those jobs. The Kansas Industrial Retraining (KIR) program reimburses businesses for retraining existing employees who are at risk of being displaced because of obsolete or inadequate job skills or knowledge. KIR requires businesses to match the amounts for which they’re reimbursed dollar-for-dollar.
- Statutory Goals: Statute doesn’t identify the goals of or intent behind the programs. The programs appear to support the creation or retention of jobs that pay adequate wages.
- Qualifying Criteria: To participate in KIT or KIR, businesses must pay at or above the county median wage for the new or retained jobs. Businesses must also provide adequate health insurance coverage. Other requirements may exist for businesses in specific industries. For example, non-manufacturing businesses must get more than half of their revenues from outside Kansas.
- Program Histories: The Legislature created KIT and KIR in 1988. The programs haven’t changed significantly since then.
Promoting Employment Across Kansas
- Program Description: The Promoting Employment Across Kansas (PEAK) program allows businesses to keep 95% of state withholding taxes for new jobs. Businesses must pay jobs at or above the county median or industry average wage to keep withholding taxes.
- Statutory Goals: According to K.S.A. 74-50,210, the intent of the PEAK program is to promote economic development. This program does this by creating new jobs and incenting businesses to locate in Kansas.
- Qualifying Criteria: To participate in PEAK, a business must meet certain criteria. A business must:
- Be a new, relocating, or expanding business that creates new jobs.
- Be a for-profit businesses or not-for-profit headquarters. Some industries don’t qualify. For example, a business can’t be in the gambling or utilities industries unless it’s a headquarters.
- Provide adequate health insurance to full-time employees. A business must also pay at least half of employees’ premiums.
- Not owe local, state, or federal taxes or be seeking protection under bankruptcy code.
- Program History: The Legislature created PEAK in 2009. Since then, the program has changed in a few notable ways. For example:
- In 2010, the Legislature allowed start-up and expanding Kansas businesses to participate in PEAK. Wage standards changed to county median or industry average wage. Standards were previously based on county average wage.
- In 2014, the Legislature changed the cap on PEAK benefits all businesses could receive each fiscal year, in total. Since fiscal year 2018, the cap has been $42 million.
- In 2018, businesses stopped being eligible to participate in PEAK for retaining jobs. Since 2018, businesses have had to create new jobs to be eligible. Some agreements requiring businesses to retain jobs are still in effect because they started before 2018.
Appendix D – Selected Incentive Project Details
This appendix details the 28 selected projects we modeled for this evaluation. All figures are in 2020 dollars and rounded.
| Incentive programs | Total incentive costs (a) | Total tax effects | Tax effects per $1 of incentive costs | Total economic impacts (b) | Economic impacts per $1 of incentive costs | |
| Business 1 | JCF, PEAK | $268,000 | $138,000 | $0.52 | $2.0 million | $7.57 |
| Business 2 (c) | KIR, PEAK | $15,000 | $8,000 | $0.50 | $114,000 | $7.39 |
| Business 3 (d) | HPIP, JCF, KIT, PEAK | $26.3 million | $13.6 million | $0.52 | $186.7 million | $7.09 |
| Business 4 | KIT, PEAK | $3.1 million | $1.5 million | $0.47 | $19.0 million | $6.10 |
| Business 5 | KIR | $29,000 | $12,000 | $0.42 | $142,000 | $4.88 |
| Business 6 | KIR | $14,000 | $6,000 | $0.43 | $58,000 | $4.21 |
| Business 7 | KIT, PEAK | $80,000 | $33,000 | $0.42 | $330,000 | $4.12 |
| Business 8 | KIR | $11,000 | $4,700 | $0.41 | $42,000 | $3.69 |
| Business 9 (d) | PEAK | $26.4 million | $10.7 million | $0.41 | $94.5 million | $3.59 |
| Business 10 | HPIP, KIT, KIR, PEAK | $1.9 million | $790,000 | $0.41 | $6.3 million | $3.25 |
| Business 11 | KIR | $35,000 | $14,000 | $0.39 | $109,000 | $3.09 |
| Business 12 | PEAK | $3.4 million | $1.3 million | $0.39 | $9.3 million | $2.71 |
| Business 13 | JCF | $183,000 | $69,000 | $0.38 | $410,000 | $2.24 |
| Business 14 | PEAK | $1.6 million | $581,000 | $0.37 | $3.4 million | $2.17 |
| Business 15 | HPIP, JCF, KIT, KIR, PEAK | $6.4 million | $2.4 million | $0.37 | $12.5 million | $1.95 |
| Business 16 | HPIP, JCF, PEAK | $11.8 million | $4.2 million | $0.36 | $22.6 million | $1.91 |
| Business 17 | JCF, PEAK | $2.7 million | $976,000 | $0.36 | $4.8 million | $1.77 |
| Business 18 | PEAK | $211,000 | $76,000 | $0.36 | $288,000 | $1.36 |
| Business 19 | HPIP, JCF, KIT, KIR, PEAK | $2.8 million | $974,000 | $0.35 | $3.3 million | $1.18 |
| Business 20 (d) | HPIP, JCF, KIT, PEAK | $610,000 | $212,000 | $0.35 | $705,000 | $1.16 |
| Business 21 | HPIP, KIT, KIR | $1.5 million | $495,000 | $0.34 | $1.6 million | $1.12 |
| Business 22 | KIR | $15,000 | $5,000 | $0.35 | $16,000 | $1.07 |
| Business 23 | HPIP, KIT | $2.6 million | $840,000 | $0.33 | $1.9 million | $0.76 |
| Business 24 | PEAK | $599,000 | $192,000 | $0.32 | $367,000 | $0.61 |
| Business 25 (c) | JCF | $122,000 | $42,000 | $0.34 | $4,000 | $0.03 |
| Business 26 (d) | JCF | $255,000 | $84,000 | $0.33 | $6,000 | $0.02 |
| Business 27 (c) | KIT, PEAK | $146,000 | $41,000 | $0.28 | -$1,000 | -$0.01 |
| Business 28 (c) | KIT, PEAK | $0 | (e) | |||
| (a) Some incentive costs are estimates. Not all businesses have completed or used all their incentive benefits. It’s not clear whether they’ll do so. (b) This refers to private sector economic impacts. It includes things like increased worker income and increased property values. (c) These businesses failed to comply with the terms of their JCF or PEAK agreements. They were asked to repay benefits they had received, but not all did so. (d) Some incentive agreements included multiple businesses. These businesses were closely related (e.g., one owned the other). We modeled them as a single project. (e) We considered this to be a failed project. The business went bankrupt soon after it started participating in PEAK. It repaid its benefits immediately, so there was no cost to the state. But it’s unlikely the project generated significant positive impacts. Source: LPA analysis of Department of Commerce and Department of Revenue incentives data |
||||||
| Kansas Legislative Division of Post Audit | ||||||