Industrial Revenue Bonds Property Tax Exemptions
Introduction
This audit satisfies requirements in K.S.A. 46-1137. The Legislative Post Audit Committee authorized us to evaluate this incentive at its June 1, 2020 meeting.
Objectives, Scope, & Methodology
State law (K.S.A. 46-1137) requires us to include 3 components in our evaluations of the state’s economic development tax incentives: a description of the incentive, a literature review, and an estimate of the incentive’s economic and fiscal impact.
Our main objective was to answer the following question:
- What are the economic and fiscal impacts of selected industrial revenue bond exemptions (IRBXs)?
To answer this question, we talked to officials and reviewed information from the Board of Tax Appeals (BOTA) and the Departments of Commerce and Revenue. We also talked to and reviewed information from several local government and school district officials across the state. We reviewed data on all industrial revenue bonds issued and exemptions granted during 2005-2020. We selected 8 exemptions to review in detail. That review included the use of a research-based simulation model. We consulted with economic development experts who helped us determine our analysis methods and interpret our modeling results.
A lack of comprehensive data limited our work. We relied on local governments’ property tax exemption information and businesses’ job creation estimates to model the effects of the 8 IRBXs we selected. More specific details about the scope of our work and the methods we used are included throughout the report and in Appendix B. This includes significant assumptions we relied on for our analysis.
Important Disclosures
We conducted this performance audit in accordance with generally accepted government auditing standards. Those standards require that we plan and perform the audit to obtain sufficient, appropriate evidence to provide a reasonable basis for our findings and conclusions based on our audit objectives. Overall, we believe the evidence obtained provides a reasonable basis for our findings and conclusions based on those audit objectives.
Audit standards require us to report our work on internal controls relevant to our audit objectives. We evaluated internal controls at selected cities and counties, BOTA, and Revenue for ensuring IRB and IRBX data accuracy. Audit standards also require us to report deficiencies we identified through this work. BOTA didn’t have controls to ensure the accuracy of the pre-project estimates cities, counties, and businesses submit. Further, most entities we talked to didn’t track comprehensive data about IRBXs’ outcomes (e.g., actual taxes exempted and jobs created).
Our audit reports and podcasts are available on our website (www.kslpa.org).
Background
Incentive Description
Cities and counties issue industrial revenue bonds (IRBs) to help finance business facilities.
- The Kansas Legislature authorized cities to issue IRBs in 1961. It expanded this authority to counties in 1981. The Kansas Development Finance Authority (KDFA) can also issue IRBs, but this is rare.
- Cities and counties issue IRBs to help finance business facilities in their communities. This includes purchasing, building, expanding, equipping, or remodeling facilities. Statute allows nearly any industry to use IRBs.
- The business uses the bond proceeds to finance its facility and is responsible for repaying it. By law, cities and counties can’t repay IRBs with other revenue.
- IRBs are beneficial to businesses, bondholders, and communities. Businesses using IRBs benefit from cheaper financing. IRB interest rates are usually lower than other options, like loans or other bond types. IRB bondholders may get income tax breaks on the interest they earn, so they may accept lower interest rates. Communities benefit from enhanced business facilities.
Cities and counties can grant businesses using IRBs property tax exemptions (IRBXs) for up to 10 years.
- Property tax revenues go to many government entities (primarily cities, counties, and school districts). About 1% goes to the state. Some areas also have special purpose districts like fire districts or community colleges that get property tax revenues.
- In addition to issuing a bond, statute lets cities and counties grant IRB property tax exemptions (IRBXs). Cities and counties can grant a property tax exemption for nearly any IRB-financed property.
- Cities and counties decide how much property tax to exempt, up to 100%. They also decide how long the IRBX will last, up to 10 years. After 10 years, the business would pay full property tax on the enhanced property.
- KDFA and Board of Tax Appeals (BOTA) officials told us getting the IRBX is one of IRBs’ main benefits for businesses.
- Businesses using IRBs also benefit from a sales tax exemption, but we didn’t review that benefit as part of our work.
State law doesn’t include any goals for IRBXs.
- Statute broadly says IRBs should stimulate and develop Kansas’ general welfare and economic prosperity. It says they should assist in the location, expansion, and retention of businesses and industry. And they should promote economic stability through things like greater employment and industry diversification.
- Statute is silent on the purpose or goals of industrial revenue bond exemptions (IRBXs). For example, although most IRBXs we reviewed included job creation goals, statute doesn’t explicitly require new jobs.
- Cities and counties decide which projects can use IRBs or get IRBXs. Local officials told us they prioritize different things. For instance, Wichita officials said they prioritize certain industries, like aerospace and information technology. By contrast, Marion officials said they prioritize historic buildings.
Cities and counties administer and oversee IRBs and IRBXs, but no one collects comprehensive data about what happens after IRBXs are granted.
- Cities and counties administer and oversee their own IRB and IRBX programs with little state-level involvement.
- When a city or county grants an IRBX, they must file some information with BOTA. That information includes applications, legal documentation, and pre-project job creation and property tax exemption estimates.
- Statute requires BOTA to collect these statements and ensure they’re complete. It doesn’t require BOTA to review their accuracy or approve or deny them.
- As a result, neither BOTA nor most of the 8 cities and counties we talked to collect comprehensive IRBX data or track what actually happens after an IRBX is granted. As a result, we generally used pre-project job creation estimates from BOTA and property tax exemption data from county appraisers.
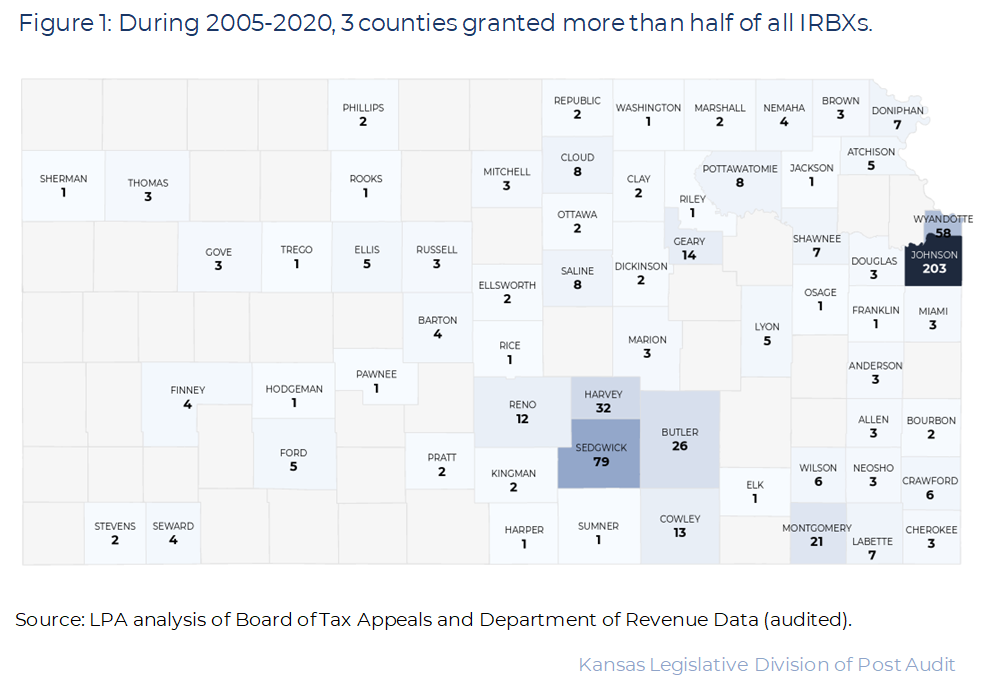
During 2005-2020, about 640 IRBXs were granted, and we estimate they reduced statewide property tax revenues by roughly $100 million each year.
- We reviewed the available BOTA and Department of Revenue data to determine how many IRBXs were granted during 2005-2020.
- Figure 1 shows that cities and counties granted about 640 IRBXs during 2005-2020. 63 counties (60%) had at least 1 IRBX in these years. But more than half of all IRBXs were granted by Johnson, Sedgwick, and Wyandotte counties. Johnson County had the most of any single county (203, or 32%).
- We had to estimate how much IRBXs reduced property tax revenues statewide. BOTA and Revenue hold data on the total appraised value of properties with IRBXs in each county. But these data didn’t include the details needed to determine how much property tax this represented. This includes things like the mill levy and property classification (e.g., commercial, agricultural). As such, we used countywide average mill levies and different possible property classifications to create a range of exempted taxes.
- We estimate these IRBXs may have reduced property tax revenues across the state by up to about $1.2-$1.5 billion total over 2005-2020 (or roughly $100 million per year). Because no comprehensive IRBX data exist, we don’t know whether the available data reflect a 100% property tax exemption for each project. This isn’t always the case, so the actual amount may be less.
- The property tax exempted mostly affects local government revenues. But about 1% (roughly $1 million per year) would be state property tax revenue.
Selected IRBXs’ Economic Activity and Tax Revenue Effects
We modeled 8 selected IRBXs with economic development experts’ help.
- To evaluate IRBXs’ economic and fiscal impacts, we used a research-based simulation model. Dr. Timothy Bartik of the non-profit W.E. Upjohn Institute for Employment Research created it. He’s a leading expert on the impacts of economic development incentives. He helped ensure we used his model correctly.
- Other models might yield different results, but we thought Dr. Bartik’s model best fit IRBX incentives. It accounts for the possibility incentives may not change business behavior. And it reflects opportunity costs related to paying for incentives. Like most models, Dr. Bartik’s model focuses on jobs created and their effects on public finances and the private economy. IRBX is not a job creation tool, but nearly all IRBXs we reviewed involved projects that projected creating new jobs.
- We also consulted with 3 professors from Kansas State University and the University of Kansas. Appendix D lists them. They provided input on our methods, including which IRBXs to evaluate, which model to use, and how to use it. They also helped us interpret and report our analysis results.
- We didn’t have time or data to model every IRBX. We reviewed 8 of the 640 IRBXs granted during 2005-2020. Appendix E details the 8 projects. We looked at large and small businesses from different industries. Our selection includes both urban and rural counties, different years, and various bond amounts. We modeled these IRBXs over 30 years to give long-term effects time to accrue.
- We don’t know how these 8 IRBXs compare to the rest or how closely they will match the assumptions we made. For example, we don’t know if businesses will create the number of jobs they projected or if those jobs will remain for 30 years. Thus, we can’t draw conclusions about all exemptions or the IRBX program overall.
- There are multiple ways to analyze an incentive’s economic and fiscal impact. This is just one. That limits the conclusions we can draw about the IRBX program, but we think our analysis still provides useful information for thinking about individual exemptions.
The model estimates the economic and fiscal impacts of each IRBX from two perspectives—economic activity and tax revenues.
- An IRBX’s cost reflects the property tax revenues the city, county, state, and other taxing districts forego for up to 10 years. Governments bear this cost in the hope it will produce positive returns. These returns can come in 2 areas: private sector economic activity and public sector tax revenues.
- Economic activity measures the economic effects businesses generate when they create jobs. This includes the jobs and the secondary effects these workers have on things like real estate values and other businesses’ profits. These contribute to the state’s gross domestic product. Models like Dr. Bartik’s estimate the total dollar value of an IRBX on the Kansas economy over time.
- For example, the business granted an IRBX may create new jobs. These workers may spend their wages on goods and services from other businesses. This helps grow those businesses and create jobs there, too.
- New jobs may also lower the area unemployment rate, creating higher demand for workers. This may raise workers’ wages, giving them more money to spend at other businesses. But businesses may also have to pay their staff more because they’re in higher demand.
- Real estate demand may go up if new residents move in to take newly created jobs. This increases real estate values for residents and businesses.
- This economic activity, in turn, impacts state and local tax revenues. New tax revenues can offset foregone property taxes. For example, more jobs and higher wages increase state income tax revenues. More spending at businesses increases state and local sales tax revenues. And increasing real estate values increase state and local property tax revenues.
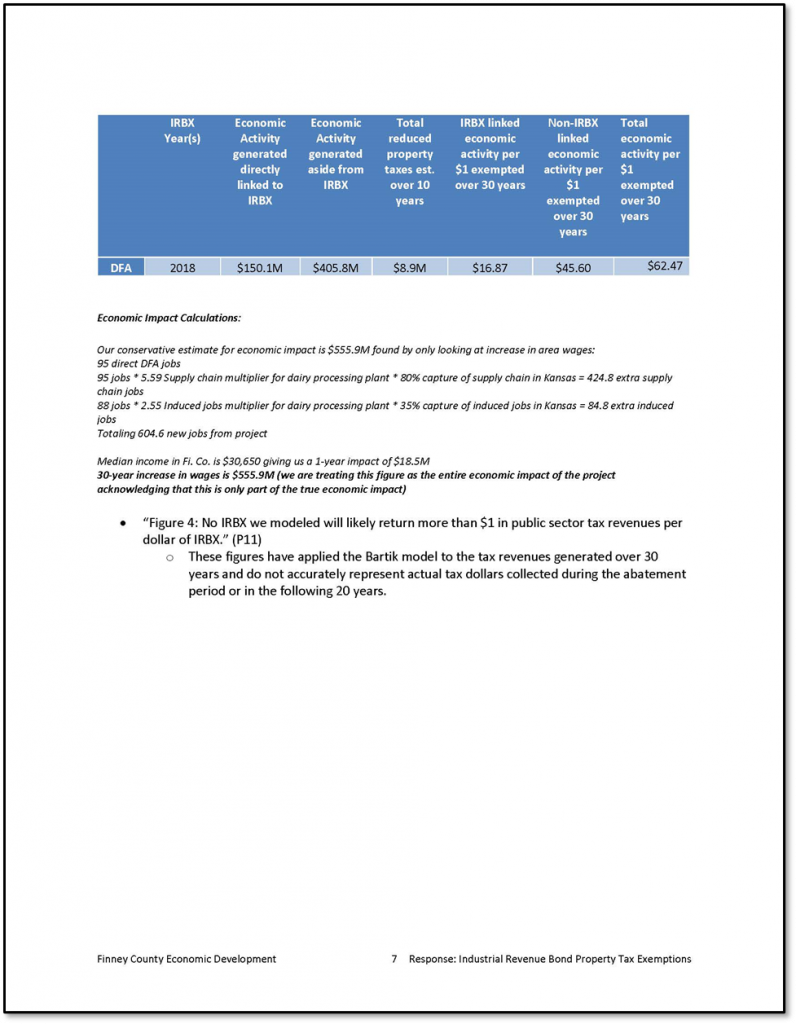
- Dr. Bartik’s model doesn’t include as a benefit businesses’ higher property values and taxes when the tax exemption ends. But it does estimate these through higher real estate values and property tax revenues tied to new job creation. This means the model reflects these benefits using averages. Sometimes it might underestimate or overestimate them.
We can’t say how much economic impact would be needed to make an IRBX successful.
- State law doesn’t define goals for IRBXs, so there isn’t a benchmark to compare to our modeling results. It’s up to state and local officials to decide what would be acceptable.
- An incentive’s impacts can each be calculated as returns per $1 of incentive. This shows how much economic activity and tax revenue each $1 given up because of the incentive will yield.
- The model estimates an IRBX’s economic activity return and tax revenue return, which may differ significantly. For example, an IRBX may produce significant economic activity, but not generate enough public sector tax revenue to offset its initial cost.
- Both types of returns are potential indicators of an IRBX’s success. A return greater than $1 indicates economic activity or tax revenue greater than the incentive’s cost. Adding returns from both economic activity and tax revenue provides a more comprehensive picture of the IRBX’s impact.
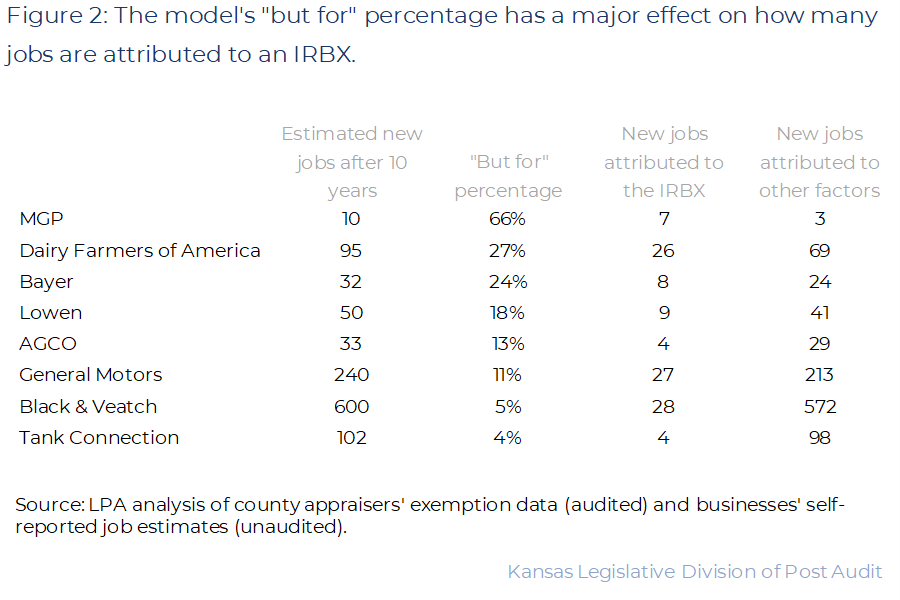
The number of jobs a business creates and the likelihood it created them because of an IRBX are key to our results.
- The model focuses on long-term effects from job creation to estimate the returns associated with an IRBX. Its primary inputs are the IRBX’s cost (i.e., forgone property taxes) and the jobs it’s intended to create.
- An important component is how many jobs the business created because of the IRBX. This is commonly referred to as the “but for” percentage. If the business would have created the jobs anyway, the city or county didn’t need to grant the IRBX to get them. We think economic activity or tax revenues should only be attributed to an IRBX if it was a factor in creating them.
- Because so many factors influence a business’s decision to buy or enhance a facility (e.g., profitability, local infrastructure, access to qualified labor), we can only estimate how much an IRBX contributed to the decision. Dr. Bartik’s model estimates this percentage by comparing the exempted property tax amount to the project’s total value. The smaller the ratio, the smaller the “but for” percentage. The model applies this percentage to the new jobs to estimate how many should be attributed to the IRBX.
- Figure 2 shows the “but for” percentage the model calculated for each IRBX we reviewed. It also shows how this affected the number of jobs the model counted towards each IRBX’s returns. This varied widely, affecting the model’s outputs. For example, the model attributed 66% of MGP’s estimated 10 jobs to its IRBX, as the figure shows. This means the model’s returns for MGP come from these 7 jobs. Conversely, the model only factored in 4 of Tank Connection’s estimated 102 new jobs because of its low “but for” percentage.
- State and local officials should consider both job creation and the “but for” percentage when approving incentives like IRBX.
Although we estimate all 8 IRBXs we reviewed will generate positive overall returns, none will offset their costs through higher tax revenues.
We estimate 7 of 8 IRBXs we reviewed will produce economic activity returns greater than their initial costs.
- Dr. Bartik’s model estimates each IRBX’s economic activity return and tax revenue return. Both are important for understanding these incentives’ impacts, and we discuss them individually below.
- To estimate economic activity returns, we generally modeled the number of jobs the businesses said they’d create in their pre-project statements to BOTA. We tried to use Kansas Department of Labor data, but it wasn’t specific to the IRBX projects. We also modeled property tax exemption data from county assessors.
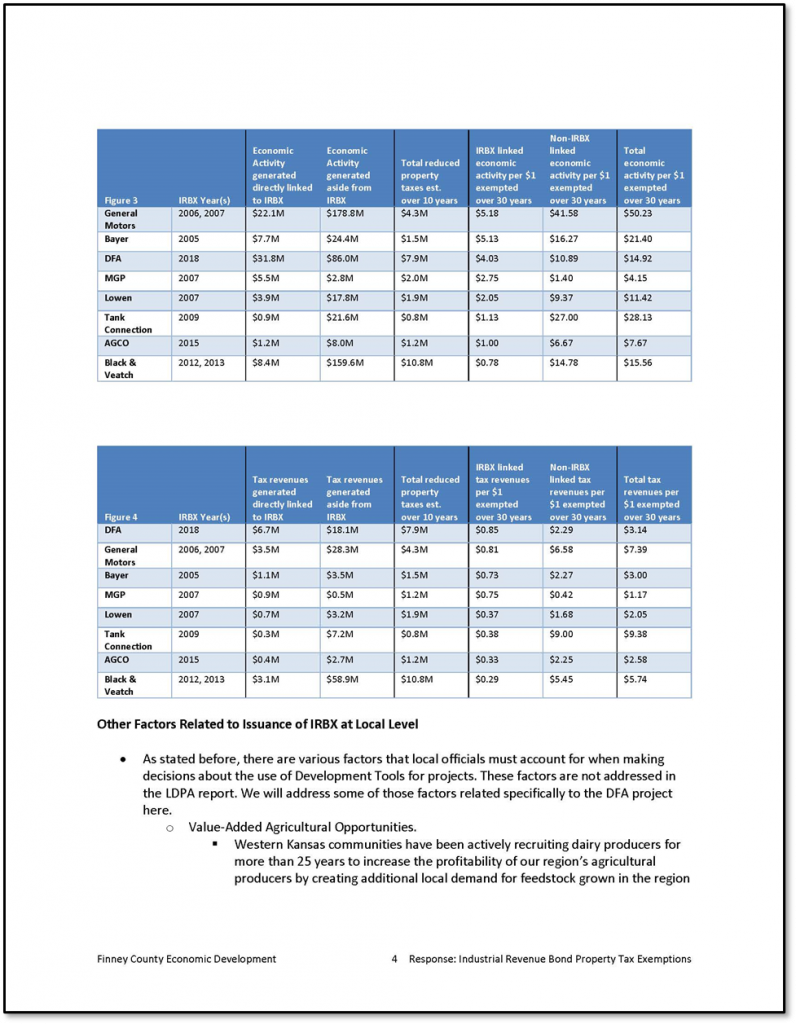
- Figure 3 shows the model’s estimated economic activity returns for the 8 IRBXs we reviewed. This reflects things like new jobs, higher pay, more spending, and higher real estate values benefiting residents and businesses.
- As the figure shows, all but 1 IRBX we reviewed will return more than $1 in economic activity per $1 exempted.
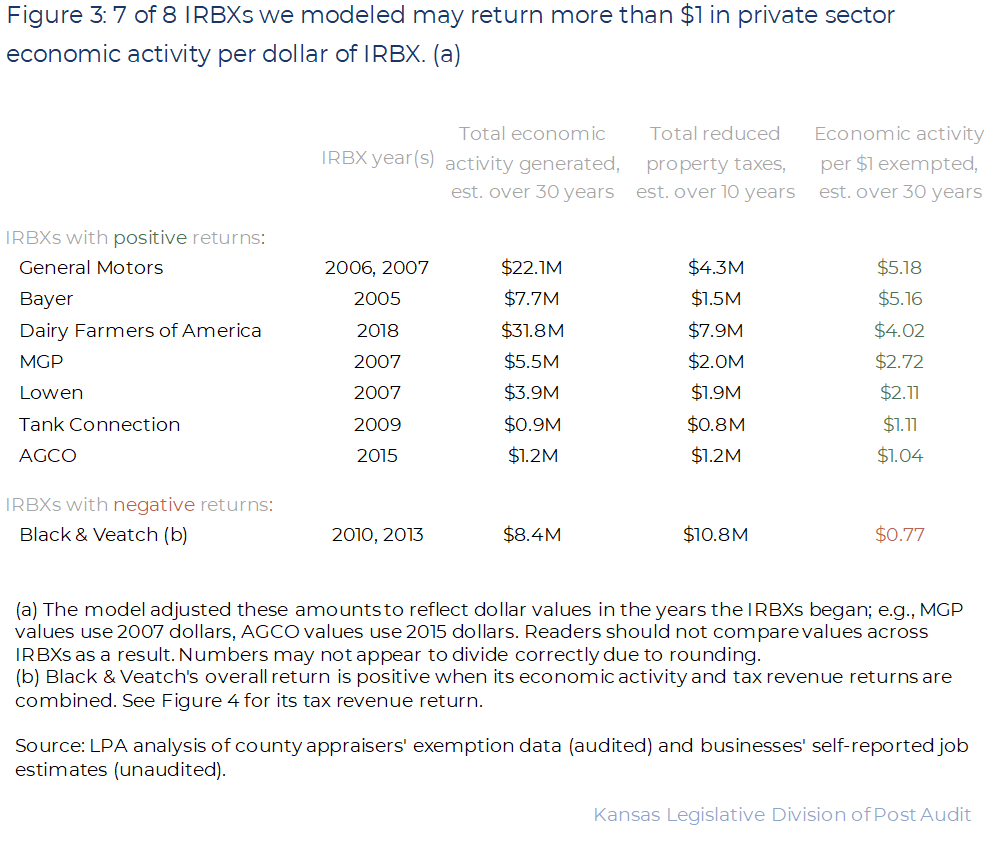
- For example, Bayer got a 10-year IRBX worth about $1.5 million in reduced property taxes. It estimated this IRBX would lead to 32 new jobs. Accounting for the “but for” percentage, the model estimates 8 of these 32 new jobs will lead to about $7.7 million in economic activity over 30 years—a return of $5.16 per $1 exempted.
- As Figure 3 shows, only Black & Veatch’s IRBX will likely produce less than $1 in economic activity per $1 exempted. However, as outlined below, this project may still yield a positive overall return.
- Of note, these economic activity returns will probably affect different groups of people differently. They aren’t likely to be equitably distributed. Appendix C describes this in greater detail.
None of the 8 IRBXs we reviewed will generate tax revenue returns high enough to offset their exemption amounts.
- As with the economic activity returns, modeling tax revenue returns uses both businesses’ job creation estimates and county appraisers’ exemption data.
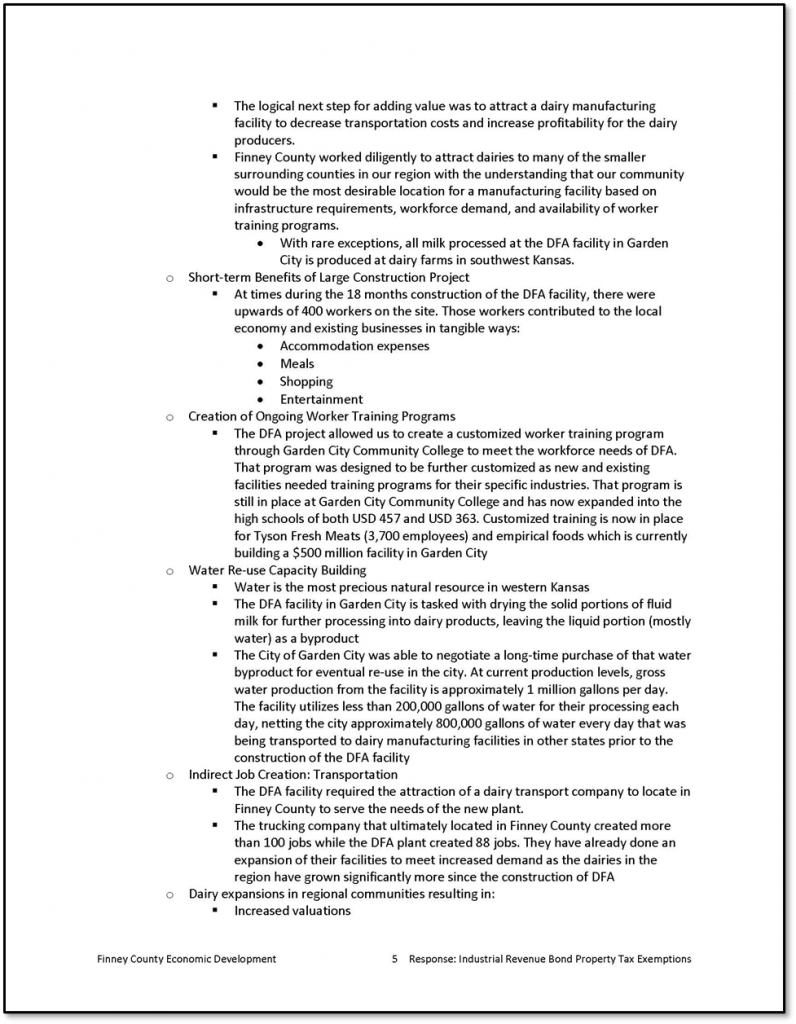
- Figure 4 shows the model’s estimated tax revenue returns for the 8 IRBXs we reviewed. This reflects things like higher worker wages increasing income tax revenues, more spending increasing sales tax revenues, and higher real estate values increasing property tax revenues.
- As the figure shows, none of the IRBXs we reviewed will return more than $1 in tax revenue per $1 exempted.
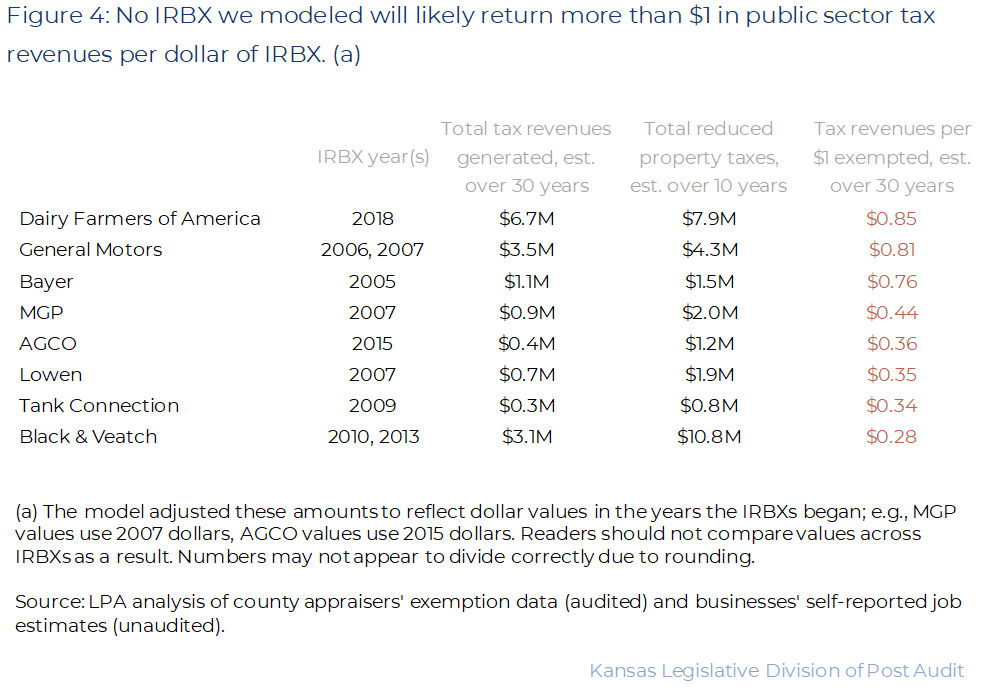
- For example, Bayer’s IRBX reduced property tax revenues by about $1.5 million. The model estimates this exemption will lead to only about $1.1 million in new tax revenue over 30 years—a return of about $0.76 per $1 exempted.
- These new tax revenues aren’t enough to offset the IRBX’s cost. The model estimates this IRBX will lead to a net tax revenue loss of about $400,000 over 30 years.
We estimate each IRBX we reviewed will yield positive overall returns through its combined economic activity and tax revenue returns.
- Adding the economic activity and tax revenue returns outlined above provides a more complete picture of each IRBX’s impact. It shows whether each incentive will offset its cost in foregone property tax revenue.
- Of the 8 we reviewed, 7 IRBXs will likely produce returns greater than $1 per $1 exempted through economic activity alone. Adding in their tax revenue returns only increases their overall returns.
- Black & Veatch’s IRBX, however, isn’t likely to produce a return greater than $1 through its economic activity alone. But when combined with its tax revenue return, this project is likely to produce an overall return greater than $1. This means it would yield positive effects overall.
Local government and school district officials told us IRBXs have positive local effects beyond the jobs they help create.
- We wanted to better understand the economic activity and tax revenue effects Dr. Bartik’s model shows. We talked to officials from 8 cities and 5 school districts.
- Local officials told us IRBXs can have value even if the business granted the exemption leaves. That’s because another business may buy the property. For example, Shawnee officials told us Bayer’s facility had been sold twice since it received the IRBX we modeled. They said the city’s largest employer currently owns it.
- Garden City officials said Dairy Farmers of America’s facility attracted a new trucking business to town. The trucking business employs more people than the original tax-exempted facility. And Kansas City officials said General Motors’s factory had attracted new parts suppliers to town.
- Garden City school district officials said IRBX-related job creation may attract families and help stabilize district enrollment.
Other Findings
Some information cities and counties reported to BOTA had major inaccuracies.
- Cities and counties provide applications, legal documents, cost-benefit analyses, and other information to BOTA before granting each IRBX. The cost-benefit analyses include estimates of the property taxes the city or county will exempt and the jobs the business will create because of the IRBX.
- We couldn’t verify the pre-project jobs estimates. We tried to verify them using actual Kansas Department of Labor data.
- The Labor data didn’t align with the estimates, including 4 that showed the businesses lost jobs after their IRBXs. Labor data reflect businesses’ total jobs instead of only jobs from the IRBX. That’s not enough detail to verify the project estimates. The job trends could be due to the businesses missing their estimates or other factors (e.g., economic downturns).
- We didn’t attempt to verify the estimates with the businesses. That’s because any other data we gathered from businesses would also be self-reported.
- We compared the tax exemption estimates cities and counties gave to BOTA to actual exemption data from county appraisers and found significant differences.
- 6 of the 8 pre-project tax exemption estimates we reviewed were off by between 18% and 266%. The other 2 IRBXs are still active. But our estimates of their future exemption totals suggest they’ll be significantly wrong, too.
- Local officials appear to have used construction costs, bond totals, or other values rather than appraised values for the estimates they gave BOTA. For example, the Tank Connection cost-benefit analysis estimated this IRBX would exempt about $1.8 million. But it exempted only about $850,000. The pre-project estimate BOTA received likely reflected an appraised value higher than the project’s bond total.
- Appraisers told us estimating future commercial real estate appraisals is difficult. And they said they’re not involved when local officials create these pre-project estimates. However, in some cases more accurate information nevertheless may have been available. For example, the Dairy Farmers of America project’s estimate reflected an appraised value significantly higher than the estimate the business provided the local government. We don’t know why the estimate BOTA received used the higher value.
- As a result, these IRBXs’ cost-benefit ratios as calculated by local officials aren’t likely to be accurate. Local officials using these analyses to determine whether to grant an IRBX are likely relying on inaccurate information. But we don’t know what effects these inaccuracies may have.
- New jobs and exempted property taxes were critical inputs for the model we used. Although they’re likely imperfect, we generally modeled businesses’ pre-project job estimates. They offered the only job creation information related specifically to all 8 IRBXs we reviewed. For exempted taxes, however, we could use county appraisers’ data showing actual exemptions.
The research literature on property tax exemptions’ effectiveness is mixed.
- Figure 5 shows the states with active incentives like IRBX. As the figure shows, most states don’t have property tax exemptions specifically tied to IRBs.
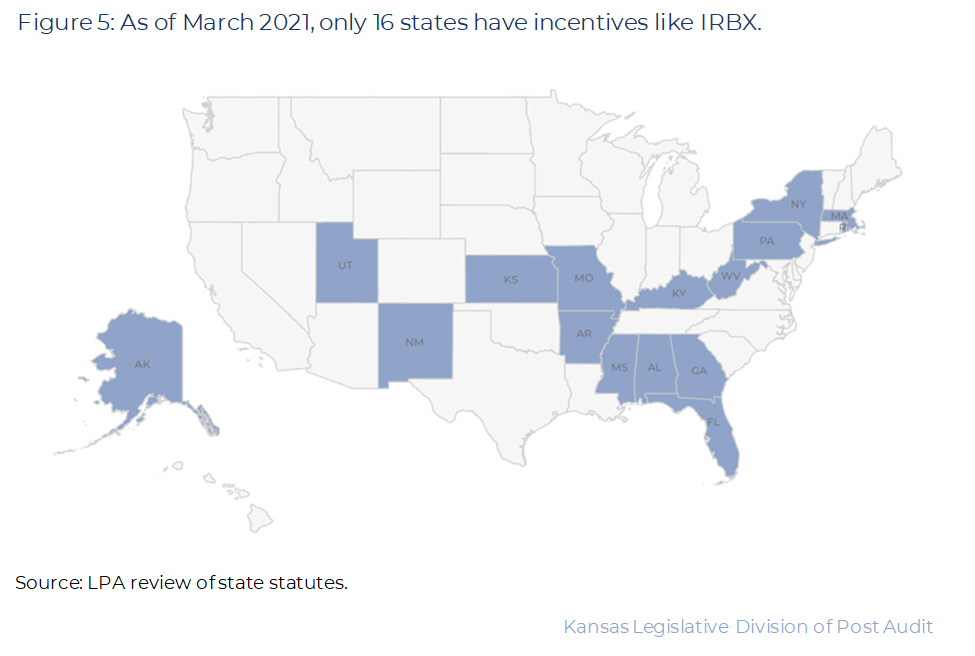
- We didn’t find research literature specifically about IRBXs. But we think conclusions from an article outlining findings on other property tax exemptions are applicable. This article summarized several studies’ findings.
- Overall, some studies found property tax exemptions didn’t affect the economy much. But others saw economic growth.
- The article concluded success depends on several factors, like which business got the exemption. For example, exporters (e.g., manufacturers) can produce greater benefits than service industries (e.g., retailers). And clusters of businesses working in the same industry can produce greater benefits than those working alone.
- The article also says an exemption is effective only when it changes business behavior. Otherwise, it wasn’t necessary to achieve the outcome. But other literature estimates incentives change only about 20% of business decisions.
- The studies included in the article suggest property tax exemptions don’t do much to attract businesses to a multi-state or multi-county region. Other factors, like labor force and infrastructure access, matter more. But once a business has decided on a region, exemptions may attract it to a specific city or county.
- Property tax exemptions do less to change business behavior as more cities and counties offer them. That’s because the business can get similar deals in many places.
Conclusion
We did not draw any conclusions beyond the findings already presented in the audit.
Recommendations
- The Kansas Legislature should consider amending statute to clarify IRBXs’ goals. This might include specific benchmarks for success.
Agency Response
On November 12, 2021 we provided the draft audit report to the Department of Revenue, the Board of Tax Appeals, and officials from the cities of Atchison, Beloit, Garden City, Kansas City, Olathe, Parsons, and Shawnee, as well as Finney County. Officials from Revenue, the Board of Tax Appeals, Finney County, and Shawnee provided feedback. We made both minor and major changes based on this feedback. This includes changes to some of our findings and conclusions.
We provided a final draft report to the same agencies and local government officials for review on February 2, 2022. Only Finney County and Shawnee officials provided feedback, and we made further minor changes based on this additional feedback.
Finney County and Shawnee officials also chose to respond to the audit. Their full responses are below. In their responses, they disagreed with our use of Dr. Bartik’s model and elements of how it works or how we used it. We reviewed their concerns but decided not to make more changes for the reasons described below.
- Finney County and Shawnee contend Dr. Bartik’s model inappropriately reflects IRBXs’ effects. This includes how the model incorporates post-IRBX property taxes for facilities that were improved. We think the model is appropriate. Although other models might show different results, Dr. Bartik and the Upjohn Institute are widely seen as tax incentive experts. The experts we consulted reviewed this model in detail and supported using it. The model reflects property tax revenue increases attributable to the IRBX through general, community-wide increases. It doesn’t treat the IRBXs as ongoing, instead reflecting their specific end dates.
- Finney County disagrees with the model’s application of the “but for” percentage to the modeling results. The model estimates the difference the incentive made to the business’s decision, and therefore the effects attributable to it. The experts we consulted with think a rigorous evaluation must attempt to account for the “but for” because it plays such a big role in estimating an incentive’s returns. Applying the “but for” percentage shows how much return the incentive itself is producing. Not including this percentage would reflect an assumption that the business made its decision solely because of the incentive. Businesses’ decisions are more complex than this, though, so attributing 100% of the project’s effects to the incentive wouldn’t accurately represent its effects.
- Finney County disagrees with our use of job creation estimates. We used businesses’ pre-project job creation estimates because comprehensive, objective IRBX-related job creation data don’t exist. We didn’t ask the businesses for information because this also would’ve been self-reported.

Appendix A – Cited References
This appendix lists the major publications we relied on for this report.
- An Evaluation of North Carolina’s Economic Development Incentive Programs. (July, 2009). University of North Carolina Center for Competitive Economies.
- “But For” Percentages for Economic Development Incentives: What percentage estimates are plausible based on the research literature? (July, 2018). Timothy J. Bartik.
- Exit Options in Firm-Government Negotiations: An Evaluation of the Texas Chapter 313 Program. (October, 2017). Nathan M. Jensen.
- Rethinking Property Tax Incentives for Business. (2012). Daphne A Kenyon, Adam H. Langley, and Bethany P. Paquin.
- Who Benefits from Economic Development Incentives? How Incentive Effects on Local Incomes and the Income Distribution Vary with Different Assumptions about Incentive Policy and the Local Economy. (March, 2018). Timothy J. Bartik.
Appendix B – Modeling Methodology
This appendix further details our methodology for modeling the 8 selected IRBXs. It includes how we used the model and important caveats.
- Dr. Bartik’s model comes with baseline assumptions and inputs. His 2018 paper on this model describes these and the underlying research in detail (item 5 in Appendix A). The economic development experts we consulted told us to change the baseline assumptions only when we had better, conclusive information. That’s because the baseline assumptions are based on a thorough review of the research literature.
- We limited our adjustments to a handful of things we thought more accurately reflect these 8 IRBXs.
- We generally used businesses’ self-reported, pre-project job creation estimates. Finney County officials provided updated job numbers they’d tracked for Dairy Farmers of America’s facility. We also used county appraisers’ property tax exemption information. These are the most important inputs for our model. For the 2 active IRBXs we reviewed (AGCO and Dairy Farmers of America), we estimated their future exemption totals using a linear model.
- Sometimes we applied assumptions or adjustments to the businesses’ self-reported new job estimates. For example, when the business didn’t break down how many jobs it expected to create each year, we assumed it would create the same number each year. Different patterns would yield different results, but they wouldn’t change the outcomes much.
- One of our experts used IMPLAN software to identify the appropriate multiplier for each IRBX’s model. This estimates how many additional jobs each new job will lead to, based on the business’s industry and location. For most, the expert suggested we use local multipliers. For Dairy Farmers of America and General Motors, the expert thought the state multipliers would be better because they account for most of their industries in Kansas.
- We adjusted several other inputs to reflect each IRBX’s initial year. We also adjusted some inputs to reflect the business’s industry. These changes make the model’s “but for” percentage and overall output more precise. They include U.S. population totals, personal income totals, and inflation rates. They include labor force participation and value-added totals for each industry. And they include Kansas unemployment rates and education spending levels.
- We reduced the number of years the model projects from 80 years to 30 years. The model’s baseline projection is 80 years from the incentive’s beginning, primarily to understand long-term effects of educational impacts. We limited this to 30 years because we weren’t sure how accurate an 80-year projection might be. 30 years still gave long-term effects time to accrue. And when we tested modeling through 80 years, it minimally changed the outcome due to the model’s adjustment of future values.
- We didn’t change most of the model’s baseline assumptions and inputs. Among these are a couple that significantly affect the model’s output. We didn’t have better, conclusive information about them. Dr. Bartik discusses his model’s baseline assumptions and inputs in his 2018 paper.
- The model assumes the state and local governments will equally raise taxes and cut public spending (i.e., 50%/50%) to cover the IRBX’s cost.
- The model uses a 3% social discount rate and a 12.5% firm discount rate when adjusting future values.
- The model doesn’t include short-term effects from capital investment. Any business that gets an IRBX must first finance capital investment with an IRB. This often creates temporary construction jobs. The model focuses instead on long-term effects from jobs more likely to be permanent.
- Further, the property tax exemptions we modeled accounted for any applicable payments in lieu of taxes.
- Sometimes cities and counties require businesses with IRBXs to pay payments in lieu of taxes. This helps make up for reduced property tax revenues and may also benefit the business.
- For example, a city or county may grant a 10-year, 100% exemption but require the business to pay a little more (e.g., 10%) of its property taxes in each of the 10 years. The business benefits from reduced taxes and a steady increase over time to its full tax amount. But the state and local governments still receive a portion of the property tax revenues.
- Finally, we only modeled IRBXs. Some businesses we looked at may have received other incentives, which may affect the results.
Appendix C – Effects on Different Groups
This appendix gives more information on how the economic activity generated by incentives like IRBXs affects people differently.
- Despite their mostly positive returns, the 8 IRBXs we reviewed likely won’t produce equitable benefits for people at different income levels.
- Dr. Bartik’s model estimates how economic activity affects people at different income levels. It shows these effects for 5 income levels, from the highest 20% of income earners to the lowest 20%. It’s based on income distribution research literature.
- The model estimates about one-third of the income these IRBXs generate will go to the top 20% of income earners. And their property will benefit from about 75% of the real estate value increases.
- By contrast, the model estimates about 12% of income will go to the bottom 20% of income earners. And they’ll benefit from only about 3% of the real estate value increases.
- Other types of incentives may produce more equitable outcomes than these. For example, incentives like worker training programs may better benefit people at lower income levels. Such incentives may help improve their skills and earning potential.
Appendix D – Experts
This appendix lists the economic development experts who consulted on this evaluation. The findings and conclusions expressed in this report are solely those of the Legislative Division of Post Audit and the individual experts. They do not necessarily reflect the views or positions of the experts’ affiliate institutions.
Donna K. Ginther, PhD Economics
Dean’s Professor
Director, Institute for Policy and Social Research
University of Kansas
Assisted by Patricia Oslund, Associate Researcher
Tami J. Gurley, PhD Economics
Associate Professor
Department of Population Health
University of Kansas Medical Center
John C. Leatherman, PhD Urban and Regional Planning
Professor
Department of Agricultural Economics
Kansas State University
Appendix E – Selected IRBX Details
This appendix details the 8 selected IRBXs we modeled for this evaluation. It shows each IRBX’s model-adjusted total.
AGCO
- Industry: Agricultural equipment design and manufacturing, including tractors and combine harvesters
- Project location: Beloit, Mitchell County
- Project description: AGCO expanded and equipped its manufacturing facility, built a new storage facility, and relocated a parking lot and road.
- IRB total: $16.6 million
- Estimated new jobs: 33
- Estimated IRBX total: $1.2 million over 10 years
Bayer
- Industry: Pharmaceutical, non-pharmaceutical healthcare, and crop science research and production
- Project location: Shawnee, Johnson County
- Project description: Bayer expanded its corporate campus. This included a 250,000 square foot warehouse and distribution facility. It also included office space for e-commerce and customer service representatives.
- IRB total: $13.2 million
- Estimated new jobs: 32
- IRBX total: $1.5 million over 10 years
Black & Veatch
- Industry: Infrastructure engineering, consulting, and construction
- Project location: Overland Park, Johnson County
- Project description: Black & Veatch purchased, renovated, and expanded a new corporate headquarters building.
- IRB total: $122 million
- Estimated new jobs: 600
- IRBX total: $10.8 million over 11 years (2 IRBXs)
Dairy Farmers of America/Meadowlark Dairy Nutrition
- Industry: Dairy product manufacturing, including cheese, butter, and milk
- Project location: Garden City, Finney County
- Project description: Dairy Farmers of America built and equipped a 320,000 square foot dairy processing facility and warehouse. It processes raw milk into powdered milk.
- IRB total: $170 million
- Estimated new jobs: 95
- Estimated IRBX total: $7.9 million over 10 years
General Motors
- Industry: Automobile design and manufacturing, including cars, trucks, and SUVs
- Project location: Kansas City, Wyandotte County
- Project description: General Motors built and equipped an assembly facility for the Saturn Aura mid-sized car.
- IRB total: $155.4 million
- Estimated new jobs: 240
- IRBX total: $4.3 million over 6 years (2 IRBXs)
Lowen
- Industry: Graphics and signage design and manufacturing, including fleet, retail, real estate, and traffic graphics and signage
- Project location: Hutchinson, Reno County
- Project description: Lowen built and equipped a 150,000 square foot corporate headquarters, manufacturing, and storage facility.
- IRB total: $21.2 million (including bond refunding)
- Estimated new jobs: 50
- IRBX total: $1.9 million over 10 years
MGP
- Industry: Distilled spirit and food ingredient research and production, including whiskey, gin, vodka, and specialty wheat proteins and starches
- Project location: Atchison, Atchison County
- Project description: MGP built and equipped an 18,000 square foot corporate office building. It also built and equipped a 19,500 square foot product research facility.
- IRB total: $7 million
- Estimated new jobs: 10
- IRBX total: $2.0 million over 10 years
Tank Connection
- Industry: Steel storage tank design, manufacturing, and installation, for liquid and dry bulk storage
- Project location: Parsons, Labette County
- Project description: Tank Connection built and equipped an 80,000 square foot manufacturing facility.
- IRB total: $4.6 million
- Estimated new jobs: 102
- IRBX total: $850,000 over 9 years