K-12 Education: Evaluating At-Risk Student Counts, Weights, and Expenditures
Introduction
2018 Substitute for Senate Bill 423 requires this audit, which the Legislative Post Audit Committee authorized at its April 30, 2019 meeting.
Objectives, Scope, & Methodology
Our audit objective was to answer the following questions:
- How does the method Kansas uses to count the number of at-risk students in a district compare to other methods?
- How does the funding school districts receive through at-risk and high-density at-risk student weightings compare to what districts spend to provide services to those students?
- Has at-risk funding been calculated in accordance with state law and how do districts spend that funding?
Our work covered at-risk funding and expenditures for the 2018-19 school year. We reviewed state law and evaluated Kansas State Department of Education (KSDE) guidance to school districts. We also interviewed stakeholders and visited school districts. Last, we analyzed district expenditures and KSDE funding data.
We reviewed expenditures for a selection of 20 out of 286 school districts. We chose these districts to get a reasonable cross-section of school districts. For those 20 districts, we reviewed $5.1 million out of $161.7 million in expenditures for appropriate use. We selected expenditures that represented the variety of expenditures districts make. The results from these 20 districts gave us a good sense of districts’ at-risk expenditures. However, these results should not be projected to all districts because we did not randomly select them.
More specific details about the scope of our work and the methods we used are included throughout the report as appropriate.
Important Disclosures
We conducted this performance audit in accordance with generally accepted government auditing standards. Those standards require that we plan and perform the audit to obtain sufficient, appropriate evidence to provide a reasonable basis for our findings and conclusions based on our audit objectives. Overall, we believe the evidence obtained provides a reasonable basis for our findings and conclusions based on those audit objectives.
Audit standards require us to report our work on internal controls relevant to our audit objectives. They also require us to report deficiencies we identified through this work. The results of that work are detailed in this report. In this audit, we reviewed KSDE’s process for calculating at-risk funding and for reviewing the programs and practices the board approves for at-risk programs and students. We also reviewed the department’s audit procedures to ensure they were sufficient to identify data inaccuracies.
Most of the 20 districts we reviewed reported spending more to provide at-risk services than they received in state at-risk funding.
In 2018-19, the state provided $413 million in dedicated funding for school districts to deliver services to students at risk of academic failure.
- Districts receive additional state funding to help students who are at risk of academic failure.
- This at-risk funding is based on the number of students in the district who are eligible for a free lunch through the National School Lunch Program (NSLP). Additionally, to be eligible for at-risk funding a student must be under the age of 20 and a full-time student.
- At-risk funding is calculated using a weighting. The number of eligible students in the district is multiplied by a weight of .484. That number is then multiplied by the base state aid per pupil ($4,165 in 2018-19). In 2018-19 state at-risk funding for all districts totaled $362 million.
- The state also provides additional funding to districts with 35% or more of its students eligible for free lunch. This additional funding is known as high-density at-risk funding. In the 2018-19 school year, the state provided $51 million in high-density funding to school districts. For this report, we will refer to both at-risk and high-density at-risk funding as at-risk funding. Combined, at-risk funding totaled $413 million in the 2018-19 school year.
- At-risk funding has increased substantially over the past 15 years. It was $111 million in 2005 and is now $413 million.
The 20 districts we reviewed received $125 million in state at-risk funding but reported spending $162 million to provide at-risk services.
- We chose 20 out of the state’s 286 school districts to review. We chose these districts for variety in location, size, and percent of students eligible for free lunch. These districts represent 30% of the state’s total at-risk funding. This sample is not projectable because we did not randomly select the districts.
- Although the way at-risk funding is calculated is consistent across the state, what districts consider to be at-risk spending varies across districts. For example, one district might consider federal Title I (a program to help students in poverty meet state academic standards) spending as at-risk spending, but another might not. This inconsistency could result in some variation in spending across school districts.
- We worked with our selected school districts to identify their at-risk expenditures. We did not include spending from certain dedicated funding sources, such as state and federal funds for English language learners. We excluded these types of funding because they are meant for a specific set of students and have their own spending rules. However, overlap between at-risk students and other types of students, such as English language learners, is common.
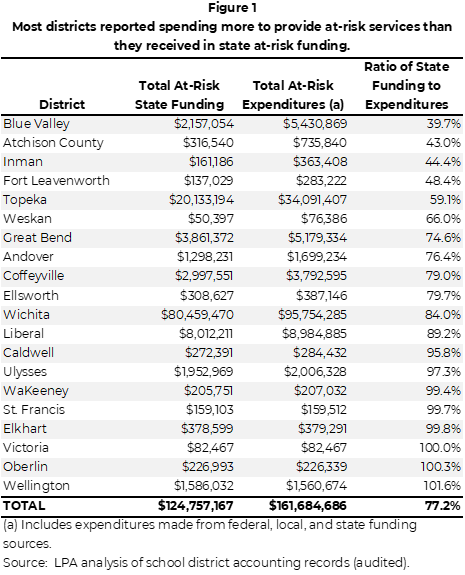
- As Figure 1 shows:
- 20 districts reported spending nearly $162 million on at-risk services in 2018-2019. That is about $2,700 spent for every at-risk student served. However, spending varied widely across districts, ranging from $948 to $5,040 per student.
- Overall, state at-risk funding covered 77% of those 20 districts’ spending. The state provided $125 million in at-risk funding to these 20 districts. That is about $2,100 per at-risk student. 12 of the 20 districts we reviewed reported spending at least 5% more on at-risk services than they received in state at-risk funding.
- Additionally, the districts reported using other state, local, or federal funds to make up the difference between what they spent and what they received in state at-risk funding. In our sample, districts spent about $37 million from these other funds ($28 million from state and local funds and $9 million from federal funds). Most of the federal spending was from funding meant to help students in poverty meet state standards.
- State law does not set a percentage of expenditures that state at-risk funding should cover.For example, state law sets an expectation that the state will pay 80% of a district’s special education transportation expenditures. State law does not establish a similar benchmark for at-risk funding.
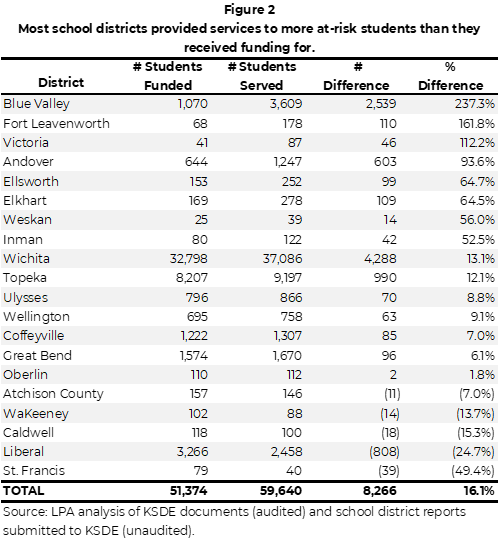
Most districts serve more students than they received state funding for because funding is not tied to services.
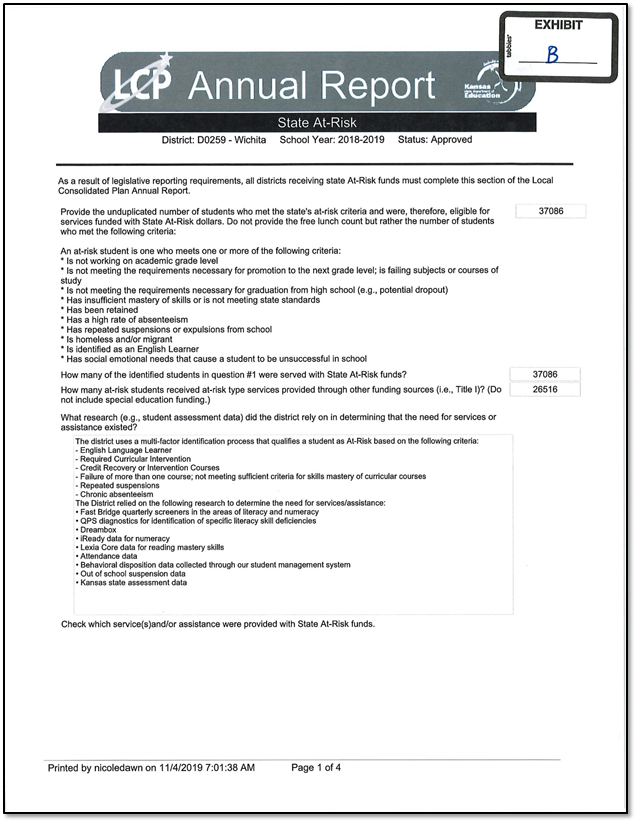
- The number of students eligible for a free lunch determines how much at-risk funding a district receives.
- However, districts determine which students will receive at-risk services based on more factors than just poverty. Student attendance, academic performance, and a student’s social and emotional needs are often considered. Districts also use teacher referrals, state assessments, and other academic test results to identify at-risk students.
- As Figure 2 shows, the 20 districts we evaluated served an average of about 16% more students than they received funding for. However, that percentage varied widely across districts. Blue Valley served 237% more students than it received funding for. Conversely, St. Francis served almost 50% fewer students than it received funding for.
- State at-risk funding does not require that the students who generate at-risk funding be the students that receive at-risk services. Which students receive services and the type of services they receive are at the districts’ discretion.
In our sample of 20 districts, most at-risk spending was used for teachers and programs for all students and did not appear to specifically address at-risk students as required by state law.
Districts serve at-risk students through a variety of programs and practices.
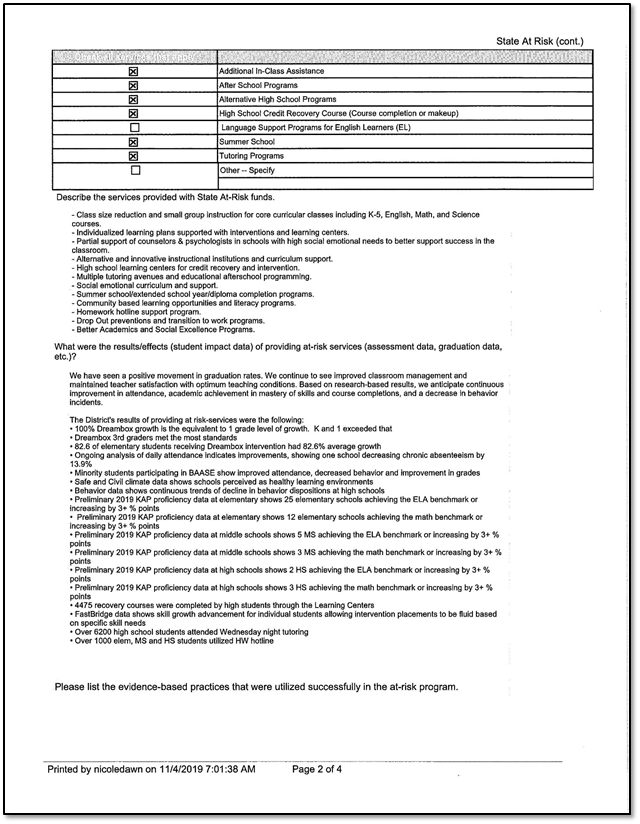
- Districts report the at-risk programs and practices they use to KSDE. Figure 3 shows the specific types of services the 20 districts reported they offer at-risk students.
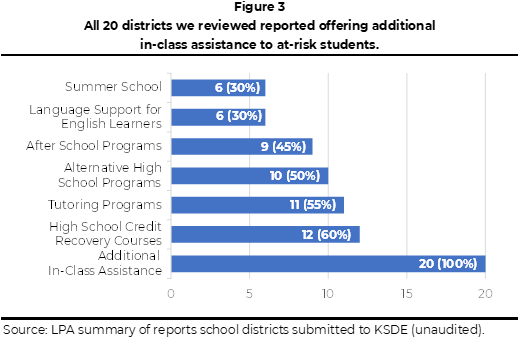
- As the figure shows, every district provided in-class assistance. This type of assistance can include one-on-one or small group instruction provided by a classroom teacher or paraprofessional. Additionally, many districts offered high school credit recovery courses. These courses allow high school students to take additional courses to catch up so they can graduate on time.
- Districts in our sample with more poverty (at least 35% of students eligible for a free lunch) offered a greater variety of services. On average, these higher poverty districts offered five services. Lower poverty districts offered only two services, on average. This is likely because higher poverty districts receive more funding and have a greater need to provide more services.
Most of the at-risk expenditures we reviewed were for classroom teachers and paraprofessionals.
- Of the $162 million the 20 districts reported spending on at-risk services, $156 million (96%) was for staff salaries and benefits.
- Of the 4,000 staff districts reported, 3,650 (91%) were classroom teachers or paraprofessionals. Figure 4 shows the types of staff districts used at-risk funds for.
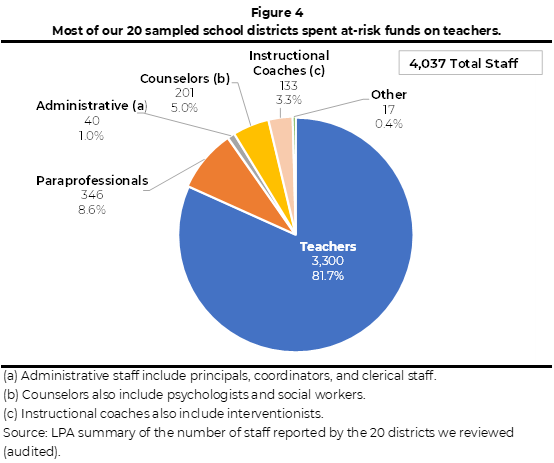
- As the figure shows, 82% were teachers and about 9% were paraprofessionals. Districts also used at-risk funds to pay non-teaching staff such as counselors and instructional coaches (staff who work with teachers to improve their teaching skills).
- In some cases, the staff member was paid for entirely with at-risk funds. In other cases, the district paid only a part of the salary using at-risk and used other funding, such as general or local funding, to pay for the remainder.
- 19 of the 20 districts we reviewed used at-risk funds to pay for classroom teachers. This included teachers who teach core classes such as math, English, or science. Most districts also reported using at-risk funds to pay for teachers who teach elective courses such as band, choir, and physical education.
Most of the at-risk funding we reviewed was spent on teachers and programs that serve all students rather than focusing on at-risk students.
- Based on state statute and KSDE documents, at-risk funding is meant to provide at-risk students with additional educational opportunities and services to meet state educational outcomes. The department provides guidance to school districts that noted that these services should be “above and beyond” what is offered to all students. Further, state law provides dedicated funding above the base state aid to help districts pay for these additional services.
- For the 20 districts we reviewed, most at-risk funds were used for regular classroom teacher salaries. KSDE does not require teachers to track the amount of time they spend providing services to at-risk students. Instead, KSDE guidance allows district to use at-risk funds to pay teacher salaries in proportion to the number of at-risk students. For example, if a school has 30% of students identified as at-risk, then 30% of classroom teacher salaries may be paid with at-risk funds.
- All 20 districts reported they provide in-class assistance to their at-risk students. For example, breaking students into small groups based on skill level so that teachers can address specific needs. Additionally, many districts told us although these teachers teach all students in the classroom, they use programs and practices that are helpful for at-risk students. Last, based on what the districts and staff at KSDE told us, in-class assistance delivered by the regular classroom teacher is the primary way at-risk services are delivered to students.
- We reviewed 29 programs and practices districts told us they were using on the What Works Clearinghouse (WWC). We did this to determine whether the practices and programs districts use were designed to meet the needs of at-risk students. KSDE lists the WWC as a resource on their website that school districts can use to identify evidence-based practices. The WWC is affiliated with the federal Department of Education and provides information on existing research for educational programs and practices. Not all programs and practices on the website have been found to be effective.
- We found that only 9 (31%) of the 29 programs and practices districts told us they were using were specifically designed for at-risk students. Our review does not cover all programs or practices school districts use. It only includes those that the selected districts reported using and that the WWC has reviewed.
- The other 20 (69%) programs and practices districts told us they used for at-risk students were also for general education. For example, the “Lexia” program provides basic reading skills instruction. Although this program may provide some assistance to struggling readers, many districts use this tool to help all students learn to read.
Many of our selected districts’ at-risk programs and practices lacked strong research finding that they are effective.
- We used the What Works Clearinghouse (WWC) to review the effectiveness of a selection of programs districts told us they use. Our review did not cover all programs or practices school districts use. It only includes those that the WWC has reviewed.
- Only 3 of the 29 programs and practices were proven to be effective.
- 3 (10%) showed clear positive effects
- 11 (38%) showed potentially positive effects
- 15 (52%) showed either no effect or mixed result
- According to the WWC, some of the most common programs districts told us they used for at-risk students had little to no effect on improving student outcomes. These include programs such as Lexia and Accelerated Reader, which are literacy programs. For example, Lexia showed potentially positive effects in reading comprehension but no effect on reading fluency.
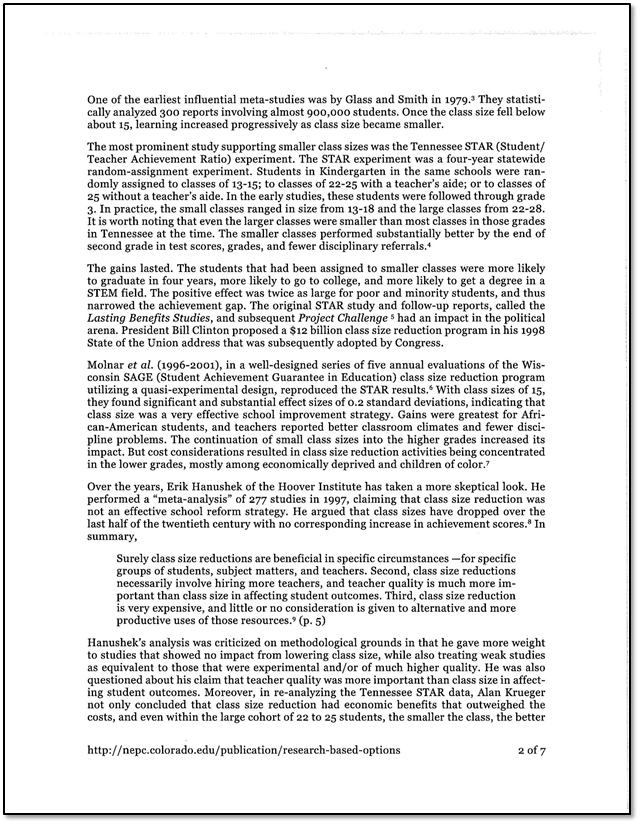
- Many districts told us they used their at-risk funding to achieve smaller class sizes, but that practice has only limited success according to several studies. Districts told us they use at-risk funds to pay for classroom teachers so they can keep class sizes smaller. As a result, we reviewed several studies examining the effect of small class sizes on student performance. Based on our research, we found two important things:
- Research found positive effects for small class sizes in Kindergarten through the 3rd grade. Students in poverty in these grades especially benefited from small class sizes. However, the results were inconclusive when looking at grades 4 through 12.
- Research noted that small changes in class size were unlikely to produce positive results. In other words, reducing class size from 25 students to 22 students is unlikely to improve student performance. Class sizes need to have 15 or fewer students to produce academic benefits to students. We did not review class sizes in the districts included in this audit
- Only 3 of the 29 programs and practices were proven to be effective.
A small portion of our 20 selected districts’ expenditures were not directly related to at-risk students or programs.
- We reviewed about 180 expenditures totaling a little more than $5 million (out of $125 million in state at-risk spending). The results from this work are not projectable to all districts or all district spending because we did not choose the expenditures randomly. They were chosen to provide a wide variety in the expenditures we reviewed. Further, we excluded federal funding from this review because federal spending rules differ from state law. Last, we took reasonable steps to isolate and review only expenditures that were likely spent from state at-risk funding.
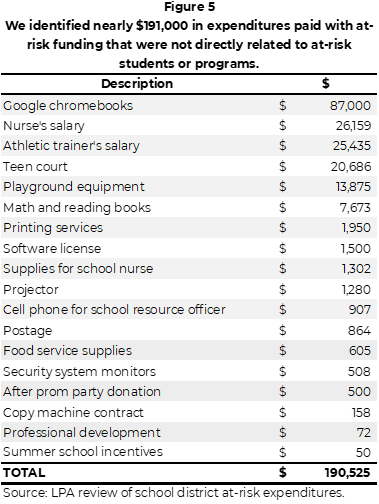
- Figure 5 shows the expenditures made using at-risk funds that were not directly related to at-risk programs or practices. As the figure shows, about $191,000 (about 4% of the expenditures we looked at) in at-risk spending was not related to at-risk programs. In some cases, the expenditure was for items available to all students. These included math books and computers. In other cases, the expenditure was not directly related to an at-risk program such as playground equipment and an athletic trainer.
KSDE has not approved strong at-risk practices or provided districts with good guidance on at-risk spending.
Most of the at-risk practices approved by the Kansas State Board of Education did not target at-risk students and were not clearly evidence-based.
- K.S.A. 72-5153 directs the state board of education to identify and approve evidence-based practices for at-risk programs and for the instruction of at-risk students. State law requires the board to review and update those practices every five years. However, department staff compile the practices and programs and maintain a webpage that includes the approved practices.
- We reviewed the at-risk programs and practices the board approved to make sure they complied with two criteria in state law. The first criteria requires that approved practices be for at-risk programs or for the instruction of at-risk students. The second requires those programs and practices to be evidence-based. Most of the programs and practices the board approved did not meet either criteria.
- Most of the approved practices and programs are not related to at-risk programs or at-risk students as required by state law. Many of the items appear to be good practices or resources for teaching generally. For example, the website has practices related to how to encourage students’ civic engagement, for teaching the science standards, and for special education. The department has also included best practices for writing instruction and Common Core math. Appendix B provides more examples of the resources the department has identified and the board has approved. KSDE staff told us that if a practice was good for all students then it would be good for at-risk students. However, at-risk students need services that are above and beyond what are available to all students. According to statute, the practices the board is supposed to identify and approve are programs and practices related to the instruction of at-risk students
- KSDE staff could not produce research to show that the approved items were evidence-based. The department also lacks a process to review educational literature for practices or programs to include. Staff told us they rely on school districts and professional organizations to provide research because they do not have enough staff to compile and review the research.
- We reviewed the approved practices and programs and found some additional concerns
- The website is a series of 83 different hyperlinks to click on making it difficult to use. Further, many of the web links open to long lists of other resources making it time consuming to locate appropriate practices or programs. For example, one hyperlink lead to a list of 62 ways to use science, technology, engineering, and math (STEM) in the classroom. Districts told us they had difficulty finding what they were looking for.
- In some cases, it is difficult to determine what the practice is. For example, one hyperlink lead to an interim report for a national commission. The report mostly highlighted the commission’s accomplishments. Other hyperlinks lead to KSDE information on other parts of their website. For example, one link leads to the state’s language arts standards. Any evidence-based practices for at-risk students were not obvious.
- Last, it is unclear which practices or programs the board has approved. For example, the webpage includes links to general resources such as the What Works Clearinghouse (WWC). The WWC includes information for hundreds of programs and practices, some of which evidence shows are effective and some of which are deemed not effective. It is unclear whether a link to a general resource, such as this clearinghouse, indicates that the board has approved every practice or program on that website.
KSDE did not update spending guidance to reflect new requirements for the 2018-19 school year.
- In the past, state law did not provide much information on the specific ways districts could or could not spend at-risk funding. To address this, the department provided guidance to districts on how they could spend at-risk funding. For example, KSDE told districts they could spend their at-risk funding on counselors, equipment, and classroom teachers. Further, KSDE prohibited districts from spending at-risk funding on professional development and school resource officers
- The Legislature implemented new spending rules starting with the 2018-19 school year. Beginning that year, districts are only allowed to spend at-risk funding on programs or practices the board has approved. Districts can also spend at-risk funding on the educational personnel and contracted services related to those programs or practices. The new law is silent on whether at-risk funding can be used for certain expenditures such as transportation, supplies, or training.
- KSDE staff continued to provide guidance to school districts but did not update it to reflect the new spending restrictions. The guidance document is on the KSDE website. KSDE staff told us they forgot to update the document with this new rule. However, they told us they provided the correct information to districts on other documents and in the annual training they hold with districts.
These issues likely contributed to many of the problems we found with how districts spent their at-risk funding.
- KSDE’s guidance document to school districts did not mention that the districts could only spend at-risk funds on the programs and practices the board approved. As a result, many districts did not seem to understand that was a requirement. Some districts indicated to us that they could spend funds on any evidence-based practice. Other districts reported spending funding for programs or practices approved for other programs. For example, districts referred to approved programs or practices related to virtual schools, federal programs, and other state programs.
- Districts likely spend most of their at-risk funding on regular classroom teachers because KSDE guidance tells them this is allowable. KSDE allows districts to pay for regular classroom teachers in the same percentage of at-risk students in the building. It is not clear that this meets the purpose of at-risk funding based on the process laid out in state law.
- The board has largely approved a collection of general resources for teaching. We were not able to connect the programs and practices districts told us they used to the items the board has approved. As a result, although we did note concerns about how districts spend at-risk funding, we could not clearly determine whether most at-risk spending complied with state law.
- Last, school districts reported they had problems using the website. Some reported that it was not user friendly and difficult to find what they were looking for. Others reported it did not include programs or practices that were helpful for their students’ unique needs.
KSDE’s management of the approved at-risk programs reduces effective oversight and makes it more difficult for districts to plan.
- KSDE staff told us they update the approved practices and programs throughout the school year. Additionally, they add programs or practices at the request of school districts.
- The department’s frequent additions reduce oversight. The department adds programs and practices after the district has already spent funding on those activities. State law only allows districts to spend their at-risk funding on programs or practices the board has approved. By making additions throughout the year and at district request, KSDE allows districts to justify their spending after the fact.
- Although the department should update the approved practices and programs regularly, updates occurring during the school year make it more difficult for districts to plan. This is because districts need to know what programs and practices they have to choose from when budgeting for the school year. Further, districts should have assurance that the choices they make at the beginning of the year will still be allowable at the end of the year.
Kansas provides at-risk funding based on a poverty measure similar to most other states.
Like 30 other states, Kansas uses participation in the National School Lunch Program to identify at-risk students.
- We reviewed a 2016 Education Commission of the States (ECS) report. The report found 43 states provide at-risk funding. Of those 43 states, 38 base at-risk funding on at least one type of poverty measure.
- 30 used eligibility for free or reduced lunch participation in the National School Lunch Program (NSLP)
- 4 used Title I (a federal program to help students in poverty meet state academic standards) eligibility,
- 2 used Medicaid participation, and
- 2 used Supplemental Nutrition Assistance Program enrollment
- The five states that did not use a poverty measure generally used academic performance to determine at-risk funding levels. The remaining seven states did not provide dedicated at-risk funding to school districts.
Most other states that use a poverty measure use free and reduced lunch counts.
- Kansas uses the free lunch count multiplied by a weighting factor to determine at-risk funding for districts.
- 26 of the 30 states the ECS identified as using NSLP participation provide funding for students who qualify for free and reduced-priced meals. We did not compare the weightings or total amount of funding those states provide to Kansas.
- We also contacted four states similar to Kansas to determine how they fund at-risk education. We chose states that were similar in population, income, and poverty. Those states were Nebraska, Nevada, Iowa, and Oklahoma.
- Of the four other states we looked at, three use free and reduced-price meals as the basis for their funding.
- Nevada was the exception. It provides at-risk funding to only the 35 poorest schools in the state.
Kansas’ method of basing funding on free lunch counts has strengths and weaknesses.
- Stakeholders, such as school districts and various school district associations, generally thought using free lunch counts was a good measure. This is because NSLP is a stable program with defined criteria not within the districts’ control. Statistics are also readily available and updated each year. Last, poverty is a reasonable proxy measure for how many students may require additional resources to avoid academic failure.
- However, stakeholders noted that free lunch counts might understate the number of at-risk students. This is because some parents are too proud or concerned about their citizenship status to fill out an application for a federal program. Also, the free lunch count does not capture students who may be at-risk but are not in poverty. As previously noted, districts reported providing at-risk services to an average of 16% more students than they received funding for.
- However, the free and reduced lunch count verification process has significant weaknesses that could inflate the count:
- Parents self-report their income and family size on the application. Federal law generally prohibits districts from requiring proof of income upon initial approval of the application. As a result, districts approve families that meet income eligibility without any proof of income.
- By federal rule, districts can only verify income for 3% of applicants who are within $100 of the eligibility limits. As a result, many school districts verify only a few applications each year. In the 2018-19 school year, 42% (120) of Kansas school districts verified only five or fewer applications for the year.
- As part of their annual audit, KSDE auditors review free lunch applications for signatures and dates. They do not have access to financial information for applicants and are not able to verify the self-reported income or household size information on the application.
- An audit we conducted in 2006 found that 17% of students (about 22,000 students) approved for free lunch were not eligible. The audit also estimated that about 7,000 students who were not receiving a free lunch were likely eligible for the program.
- We identified a number of audits from other states that found fraud in the program. For example, a 2013 audit by the New Jersey Comptroller found 101 public employees had provided false information on their child’s lunch application and that fraud was widespread in 15 school districts.
Stakeholders told us other possible methods, such as using the U.S. Census or academic indicators, also have flaws.
- Stakeholders mentioned basing funding on the U.S. Census, but noted it has flaws. Most significantly, certain students who are more likely to be at-risk, such as migrant students, are often not included in that count. Additionally, the annual numbers the U.S. Census publishes for school districts are estimates and often lag by a year or two.
- The state’s counts of at-risk students would decrease from 180,000 to about 68,000 if we used census data. This is largely because the census only counts the number of children who are at or below the federal poverty line. Students are eligible for the free lunch program up to 130% of the federal poverty line.
- Stakeholders also said using academic measures, such as state assessments, can have problems. Doing so often results in reduced funding as students’ academic outcomes improve. Students may still need support to continue to succeed, but the district would no longer have the funds to provide that support.
- Stakeholders told us the state could use other measures such as absenteeism or social emotional measures to determine funding. The state would have to define these measures. It would also need to develop a common tool to ensure consistency across districts.
Other findings
For the two years we reviewed, KSDE calculated at-risk funding correctly and in accordance with state law.
- We reviewed KSDE’s calculations of at-risk and high-density at-risk for the 2017-18 and 2018-19 school years. In both years, we confirmed the data elements used in the formula, such as the free lunch count and base state aid. We also compared the formula the department used to the formula written in state law.
- In both years, KSDE correctly calculated at-risk and high-density at-risk funding for all 286 school districts.
A sunset provision in state law conflicts with the department’s statutory obligation to withhold high-density funding for certain districts.
- K.S.A. 72-5151 requires KSDE to withhold high-density at-risk funding in certain circumstances. Districts are required to use high-density funding only on programs or practices the board has approved. Those who do not and do not show improvement in student outcomes in five years, lose their high-density funding for one year.
- However, state law eliminates high-density at-risk funding starting with the 2021 school year. As a result, there will not be any high-density funding to withhold if KSDE identifies districts who did not spend their funding appropriately.
Conclusion
The state’s at-risk funding is intended to provide additional services to students who are not performing adequately in school and are at risk of academic failure. At-risk funding is provided by the state to offer additional programs or services to these students to help them succeed. The state’s new requirement that at-risk funding be spent on evidence-based practices is poorly managed at the state level and not adequately implemented at the district level. Specifically, we found districts spent most of their at-risk funds on teachers without assurance the funding targets at-risk students or employs evidence-based practices and programs. That is in part because KSDE has provided districts with unclear, and at times, inaccurate guidance.
Recommendations
- The department should ensure that any guidance they provide to the districts reflects current state law.
- The department should establish a process to determine that any identified programs and practices are evidence-based and for at-risk students.
- The board should more thoroughly oversee the process for identifying at-risk programs and practices.
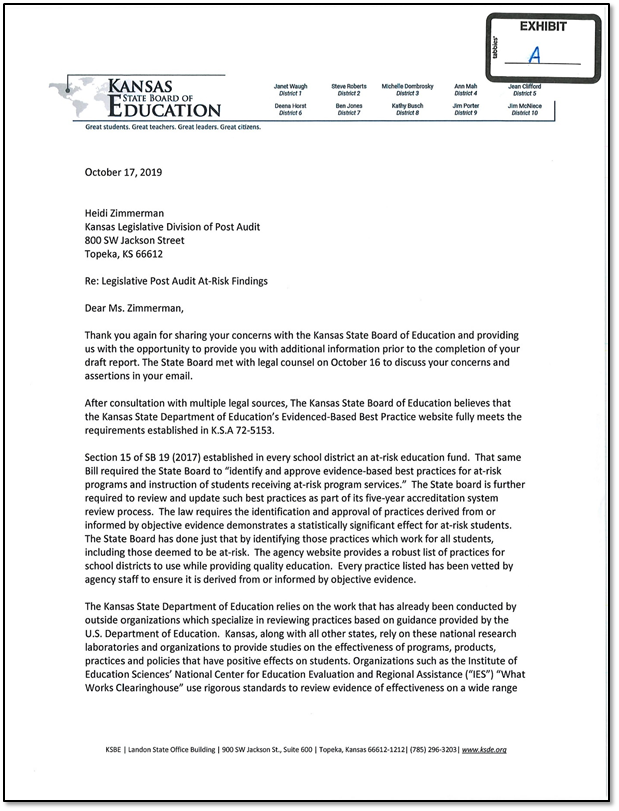
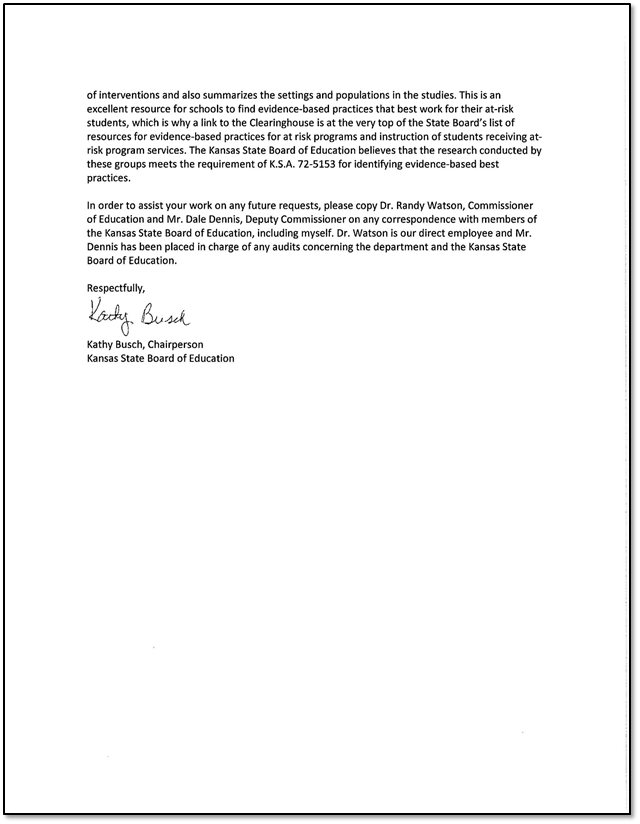
Agency Response
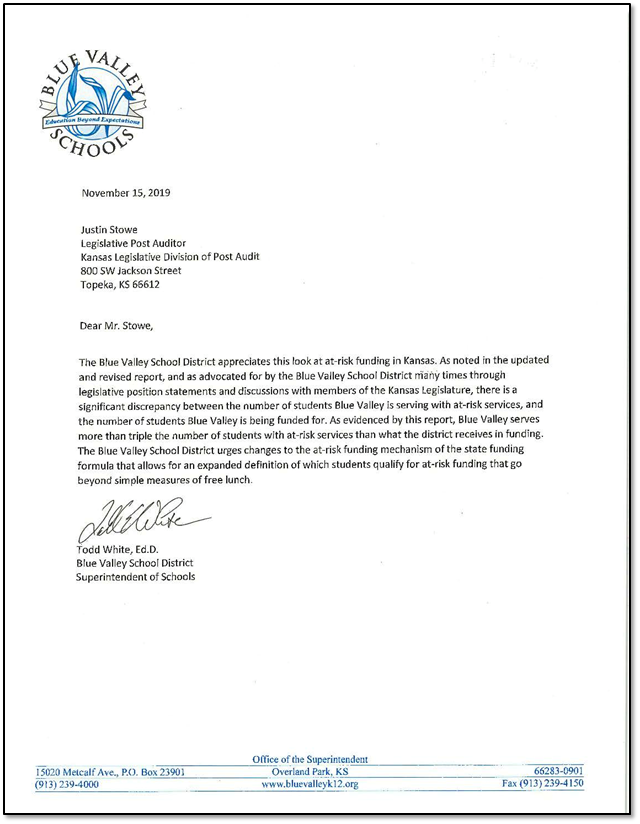
On November 1, 2019 we provided a copy of the draft audit report to the Kansas Department of Education and the State Board of Education. Additionally, we provided an opportunity for the 20 districts included in this report to submit a written response. This response was optional. One district provided a written response and it is included in this appendix.
During the draft review process, we made minor changes to the draft based on informal feedback from the department. These changes did not affect our findings or conclusions. In their formal response, department and board officials disagreed with a couple findings in the report. Their concerns and our response are summarized below. We made no changes to our findings based on their response:
- The department disagreed with our findings related to the effectiveness of smaller class sizes. We reviewed the article the department included in its response that notes some positive findings for small class size in grades 4 through 12. However, our conclusion that the overall research for small class sizes in the older grades is “inconclusive” is accurate across the broader body of research we reviewed.
- The department and board also disagreed with our findings that the programs and practices that the board has approved do not comply with state law. We stand by our conclusion for two reasons:
- State law requires that the approved programs and practices be for at-risk programs and for the instruction of at-risk students. The programs and practices the board has approved are not related to at-risk programs or students. Instead, the board has approved general teaching resources. The department has asserted that if a program or practice is good for all students than it is good for at-risk students. We do not think this view reflects what state law directs the board to do.
- State law requires the board to approve evidence-based programs and practices. The board asserted that every practice they have approved has been vetted by department staff. We asked to see this research, but department staff provided no evidence of a review. Additionally, the department’s website did not provide any information on the research or evidence supporting the approved programs and practices. As a result, we concluded the board’s approved programs and practices did not comply with this aspect of state law.

Appendix A – Cited References
This appendix includes a list of the major reports, articles, publications, or studies that we relied on for information in this report.
- Class Size Reduction. (2014). Basha Krasnoff.
- Class Size Reduction and Student Achievement (2009). Christopher Jepsen and Steven Rivkin.
- Class Size and Student Achievement (May, 2001). Ronald Ehrenberg, Dominic Brewer, Adam Gamoran, and J. Douglas Willms.
- Class Size and Students At-Risk (1998). Jeremy Finn.
- Some Findings from an Independent Investigation of the Tennessee STAR Experiment and From Other Investigations of Class Size Effects (Summer 1999). Eric Hanushek.
- Teachers, Schools, and Academic Achievement (March, 2005). Steven Rivkin, Eric Hanushek, and John Kain.
- The Impact of a Universal Class-Size Reduction Policy: Evidence from Florida’s Statewide Mandate (August, 2010). Matthew Chingos.
- The Importance of At-Risk Funding (June, 2016). Education Commission of the States.
- What Works Clearinghouse: https://ies.ed.gov/ncee/wwc/
Appendix B – Resources the Board Has Approved
This appendix includes examples from the State Board of Education’s approved evidence-based practices for at-risk students. The complete website included links to 83 resources as of October 2019.
The website can be found at: https://www.ksde.org/Agency/Division-of-Learning-Services/Special-Education-and-Title-Services/Announcements-Special-Education-and-Title-Services/Best-Practices
Civic Engagement
- A list of general resources put together by KSDE for developing curriculum for civic engagement. The list includes about 50 links to online resources.
- A curriculum that introduces the basic tools for teaching civil discourse. The curriculum is not subject specific but provides general resources for teaching argumentation and discussion in the classroom.
- A middle school and high school civics curriculum that encourages teacher led discussion and active student participation in government issues.
Math
- A comprehensive PK-grade 5 curriculum that fully implements the Common Core standards for math. It focuses on developing an understanding of math concepts and problem solving.
- A statement that urges educators to frame math education through reflecting, noticing, and engaging in the community. It asks math teachers to reflect on their own identity and beliefs.
- A list of general teaching practices for math. It includes strategies such as using mathematical representations facilitating math discourse and posing purposeful questions. The list was assembled by the National Council of Teachers of Mathematics.
Reading and Literacy
- A guide that includes a number of strategies that support literacy development. It provides information on planning literacy-based lessons, using graphs to help students organize their thoughts, and how to ask purposeful questions.
- A book that describes a specific practice for helping all students better comprehend what they are reading. It focuses on four strategies that include predicting, questioning, clarifying, and summarizing.
- A chapter from a textbook that describes strategies for improving student vocabularies. It encourages practices such as regular assessment, word mapping, and using word walls.
Science
- A list of resources compiled by the Advancing Coherent and Equitable Systems of Science Education Project. It includes resources for assessing students, using cultural experiences to make science more relevant, and recognizing student contributions.
- A resource that provides tools to teachers who are using the Next Generation Science Standards. It provides lesson plans that support student learning through investigation.
- A collection of 62 practices educators can use to teach science, technology, engineering, and math. They include practices for sequencing material, encouraging classroom discussion, and how to focus professional development.
Social Emotional/Trauma Informed Care
- Analysis of the Program for International Student Assessment (PISA). The PISA is an international assessment taken by students in 72 countries. The article notes a number of findings including that student mindset is important to academic outcomes and a mix of student and teacher led learning is best.
- A report by the National Commission on Social, Emotional, and Academic Development and the Aspen Institute. The report does not appear to contain any resources for educators but notes many of the Commission’s highlights and plans for the future.
- A list of general resources compiled by the Kansas Technical Assistance System Network. It includes resources related to trauma responsive schools, restorative practices, and mental health data.
General Resources
- The Center conducts basic research on reading growth, assessment, and instruction. The website includes a number of studies and articles related to different aspects of reading including phonics, fluency, and comprehension.
- A website that includes resources and research related to improving results for children and youth with disabilities. The U.S. Department of education runs the website.
- A searchable database that provides information on the existing research on different programs, products, practices, and policies in education. It is affiliated with the U.S. Department of Education.