The Kansas Creative Arts Industries Commission: Measuring its Economic Impact
Introduction
Representative Jerry Stogsdill requested this audit, which the Legislative Post Audit Committee authorized at its April 30, 2019 meeting.
Objectives, Scope, & Methodology
This audit answers the following questions:
- What are the current and potential economic effects generated by the Kansas Arts Industries Commission efforts?
- How does Kansas’ arts commission’s economic impacts compare to that in other similar states?
Our review of the arts commission’s economic impact covered its funding, programs, and its reported impact of those programs for fiscal years 2016 to 2019.
We reviewed state law, budget documents, and grant outcome data to understand how the commission is funded, what programs it offers, and the impact of those programs. We interviewed commission officials to understand the process for collecting economic impact data and how they analyze it. We also looked at best practices and spoke with national experts about the economic impact of the arts in general.
We looked at national data on state art agencies’ outcomes from the National Endowment for the Arts (NEA), National Association of State Art Agencies (NASAA), the Bureau of Economic Analysis (BEA), and the Americans for the Arts. We compared the commission’s efforts to that in five similar states (Iowa, Nebraska, Nevada, Missouri, and Wisconsin). We chose these states because they had similar demographics as Kansas but varied in how their arts agencies were funded. We chose this sample judgmentally, so our results are not projectable.
More specific details about the scope of our work and the methods we used are included throughout the report as appropriate.
Important Disclosures
We conducted this performance audit in accordance with generally accepted government auditing standards. Those standards require that we plan and perform the audit to obtain sufficient, appropriate evidence to provide a reasonable basis for our findings and conclusions based on our audit objectives. Overall, we believe the evidence obtained provides a reasonable basis for our findings and conclusions based on those audit objectives.
Data reliability issues with the commission’s grant recipients’ data limited our ability to fully answer the first audit question. Specifically, we were not able to use the commission’s data to estimate impact in key areas like jobs created, because the data were unreliable and inconsistent.
Audit standards require us to report our work on internal controls relevant to our audit objectives. They also require us to report deficiencies we identified as part of this work. In this audit, we reviewed the commission’s processes for maintaining accurate data on grant outcomes. We found issues with the commission’s process for collecting data from grant recipients. That finding is discussed in more detail later in the report. We also identified a minor statutory noncompliance finding with the commission’s annual reporting process. We communicated that issue to agency officials in a separate management letter. It is not included in the body of this audit.
We found little to no measurable economic impact from the commission’s efforts, and similar states do not report economic impact for their art agencies.
Kansas Arts Funding
We analyzed the arts commission because it is the state’s only agency dedicated to supporting the arts.
- The arts industries in Kansas include non-profit organizations, government entities, and for-profit businesses across many sectors (e.g. publishing, music, visual arts). Kansas has about 280 non-profit art organizations in the state. Examples include the InterUrban ArtHouse in Overland Park, the Topeka Civic Theater, The Salina Arts and Humanities Council, and the Dodge City Area Arts Council.
- All 50 states have an official arts agency. In fiscal year 2013, the Kansas Legislature merged the former Kansas Film Commission and the Kansas Arts Commission to create the Kansas Creative Arts Industries Commission (KCAIC). State law (K.S.A. 74-5209) names the commission as the official state arts agency responsible for developing and coordinating the creative arts industries in the state.
- The commission is a division within the Kansas Department of Commerce. It has 11 members and has one FTE staff position.
- The commission focuses on job growth and entrepreneurship by promoting and supporting the creative arts industries in the state. To do this, most of its spending (67% of expenditures in fiscal year 2019) is on grants to non-profits and local government entities (e.g. cities, counties, arts councils and centers, museums, and theaters). They also partner with other arts organizations and schools to offer professional development opportunities and education to community members and artists.
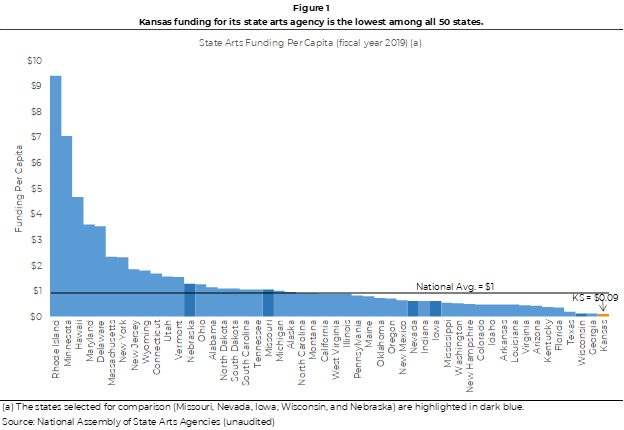
The commission’s state funding was the lowest in the nation, and Kansas’ arts economy ranked low in national comparisons.
- In fiscal year 2019, the commission’s funding was about $1 million. The National Endowment for the Arts (NEA) provides most of the commission’s funding (64% in fiscal year 2019). The NEA requires equal matching funds from the state for every dollar they provide. Most states fund above the required match. The national matching average is $8 to every NEA dollar. Kansas is only one of three states that did not have state funding meet the required match. To keep the NEA funding the commission had a special agreement with the NEA.
- State funding to the commission was about 36% of their budget. State funding comes from the Economic Development Initiative Fund (EDIF), the Department of Commerce, the arts checkoff fund, and the arts license plate fund.
- In fiscal year 2019, Kansas’ state funding to the commission ranked last in the nation and was 93% below the national average. As shown in Figure 1, state funding for state arts agencies ranged from $0.09 per capita (Kansas) to $9.40 per capita (Rhode Island) in fiscal year 2019. The national average was just over $1.00 per capita.
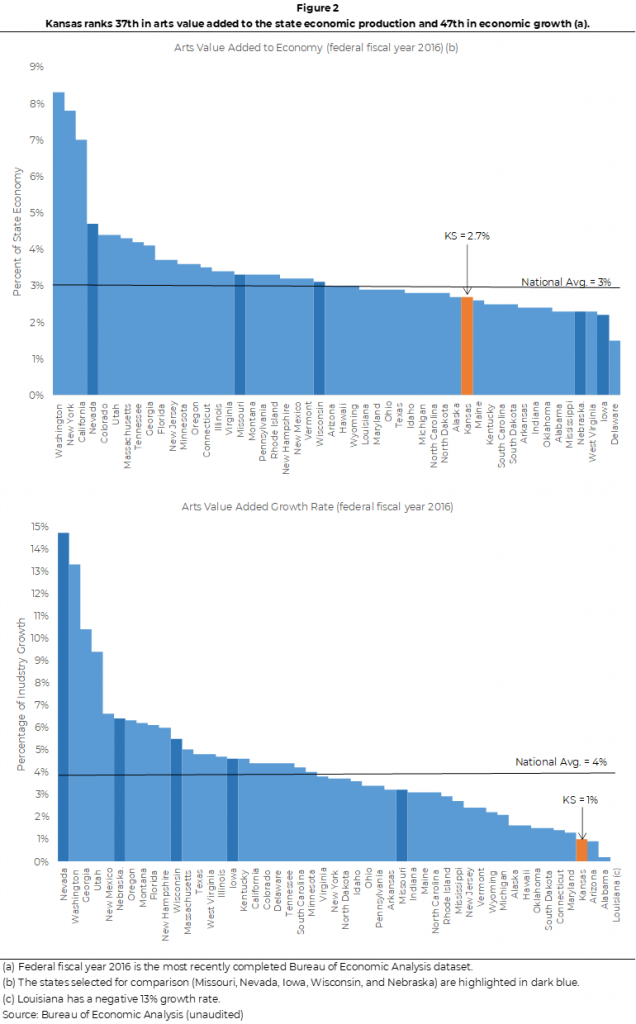
- The impact of the arts industry on the Kansas economy is much less than many other states. Federal data from the Bureau of Economic Analysis (BEA) uses a standard approach to estimate the impact of the arts on state economies. As Figure 2 shows, based on BEA data Kansas ranks 37th in value added to the state’s economy through arts and culture production and 47th in growth of those industries. Job growth in the arts also ranks low in Kansas at 45th in the nation.
Commission Activities and Impact
The commission grants went to projects that supported a variety of artistic needs but were too small to produce meaningful economic returns.
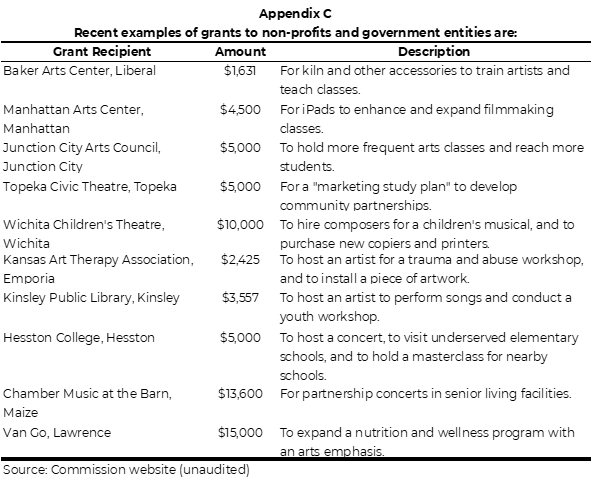
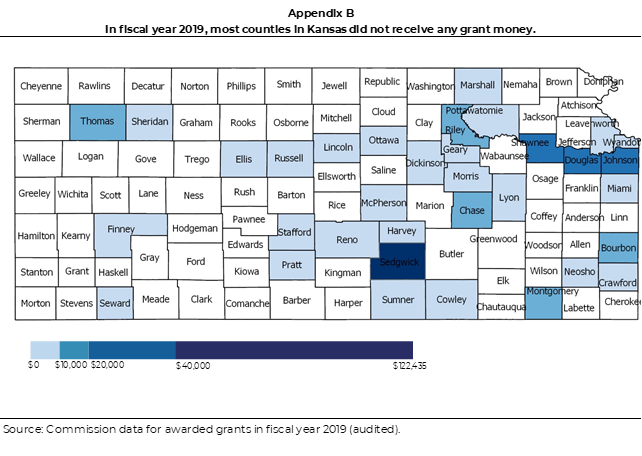
- Grants to non-profit organizations and government entities account for most of the commission’s activities. See Appendix B for a map of fiscal year 2019 grant money dispersion in the state and Appendix C for examples of recent grant awards.
- To discuss impact and results of the commission’s grants, we will be using federal fiscal year 2016. This is the most recently available dataset that has complete results (grants awarded in the most recent fiscal years will not be paid out or have impact results available until future fiscal years). 2016 appears to have typical results for the commission’s grants. The average grant amounts and projects are like those awarded in fiscal year 2018 and 2019. The commission’s state and NEA funding has also remained consistent over that period.
- Figure 3 shows just under half (44%) of the commission’s grant money went to support concerts, performances, equipment, and art creation. Other arts activity grants supported were exhibitions, instruction, professional development, and professional support. The visual arts, theater, and projects covering more than one area of the arts received most of the grant funding.
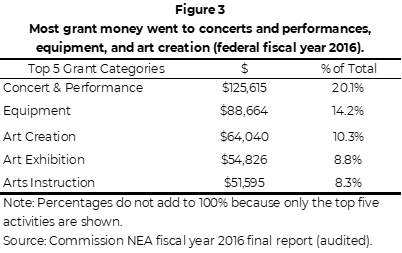
- On average, the commission’s grants were too small to cause any measurable economic impact. In federal fiscal year 2016, the commission paid out 123 grants totaling $624,000, for an average grant amount of $5,200. Grant amounts ranged from about $600 to $16,000. Most grants were for amounts of $5,000 or less.
- The commission collects data from recipients and reports on the economic impact of its grants (e.g. jobs created or affected). We found that information to be completely unreliable though (as discussed in the next section of the report).
- The only potential impact we identified was in required matching funds from grant recipients. The commission requires organizations to match funding received from their grants. On average, the commission’s grants covered only 23% of a grant project’s expenses. This means that for every $1.00 the commission invested other sources invested $3.35 in matching funds.
- Most of the commission’s grants are likely not creating new jobs even with matching investment. The average grant’s total expenses with matching funds is about $22,000, which does not equate to an FTE job.
The commission’s reported economic metrics were unreliable.
- At the end of each grant, recipients complete a final report to submit to the commission. All information the commission receives is self-reported from grant recipients. Economic metrics they collect include items such as the number of works produced, number of jobs created, number of jobs retained, number of jobs affected, and percent increase in local revenues. They use that data to calculate and report on the economic outcomes of their efforts.
- Many of the commission’s reported economic impact results were not reasonable. For example, the commission reports its average grant helped create 3 new jobs, kept 2 jobs, and affected a total of 30 jobs. It seems unlikely that a $5,200 grant ($16,100 with matched funds) could generate such results under any reasonable scenario, much less on average for the sample of 74 grants the commission provided us.
- The commission does not establish criteria and timeframes for the economic metrics it collects. For example, it does not define what a grant recipient should count as a job. The results reported also vary over different time periods (e.g. one day performances for some and calendar year for others). As a result, grant recipients’ reported information is inconsistent. For example, two reports show:
- one mural project with $11,000 in total expenses reported creating 7 new jobs.
- another mural project with $9,600 in total expenses reported creating 0 new jobs.
- Commission officials told us that some grant recipients, especially small ones, struggle to complete the required reports. Many leave categories blank, because they do not know how to complete them. Officials said they try to help grant recipients, but do not always have the staff to do so. Officials said they would like to simplify the required reporting but are unsure of which metrics they should continue to collect.
The commission also collects non-economic impact metrics for the NEA, but the results are self-reported estimates and appear overstated.
- The National Endowment for the Arts (NEA) provides grant funding to Kansas’ Arts Commission. As part of that funding, the NEA requires the commission to report certain non-economic data such as audience numbers and demographics at the end of the grant cycle. The commission collects this data from grant recipients in the final report they submit to the commission. This information measures the grant’s impact on areas the NEA focuses on such as community revitalization and underserved populations.
- The commission’s data shows on average their grants engaged 2,000 adults, 1,200 youth, and involved 33 artists.
- For example, one grant recipient reported $5,000 in grant money to conduct a survey would engage 42,000 individuals in the arts.
Even if funding were increased, stakeholders told us measuring economic impact from arts activities is difficult because it is both project specific and difficult to isolate.
- We searched for best practices to measure the economic impact of the arts industries but did not find any. Additionally, stakeholders (e.g. other states and federal officials, and national association officials) we spoke with did not know of any such best practices. We only found best practices for measuring the impact of general economic development projects.
- The stakeholders we talked to told us that the effect of the arts industry is more than economic. Stakeholders mentioned “quality of life” factors such as social emotional well-being and participation in the arts as important outcomes. Although we agree the arts industries can have these effects, our aim was to assess their impact on the Kansas economy.
- Similar states provide more arts funding per capita than Kansas, but do not measure the economic impact of their arts industry on their economies. We compared Kansas to 5 similar states (Missouri, Nevada, Iowa, Wisconsin, and Nebraska). We selected the states based on similarity to Kansas in population, geography, and spending. We also looked for variation in state art funding.
- The five comparison states had up to 14 times more in state funding per capita than Kansas. Their funding comes from state general funds and not a specific economic development fund like Kansas.
- Officials in these states told us they do not collect economic impact measures. They focus on noneconomic measures and goals such as diversity, audience participation, increasing access to the arts, and distributing grants equitably across their states. They consider the economic impact of their efforts as part of their whole outcomes and do not report them separately.
- Department of Commerce officials told us the effect of increased commission spending would depend on the specifics of the activity (i.e. the size and the purpose). They also noted that expecting an economic return is not always appropriate. For example, a grant to help establish a music therapy program in a hospital is unlikely to yield an economic return.
Other Findings
The commission receives more than 50% of its state funding from the EDIF, but we found almost no evidence that commission grants affect the Kansas economy.
- EDIF money makes up more than half of the state funding the commission receives (53% of its state funds). That funding has remained steady since fiscal year 2014 at around $200,000. However, in fiscal year 2020, EDIF appropriations were increased to $500,000.
- State law (K.S.A. 79-4804) requires EDIF be used for economic development. Our 2019 audit of EDIF found that the EDIF monies provided to the Department of Commerce, and eventually to the commission fit the broader economic development intent of those funds. The commission’s stated mission, objectives, legal obligations, and criteria for grant programs generally related to economic development.
- However, this audit found no measurable economic impact of the commission grants beyond the requirement that recipients match grant funds with funds of their own (see above). Even with matching funds, the grant and project amounts are too small to achieve measurable economic effects. This suggests that EDIF money may not be appropriate for the types of grants the commission is awarding.
Kansas’ art agency is different than most other states’ art agencies in terms of both staffing and placement.
- The commission is very small and has only one staff member whereas similar states had between 4 to 13 staff members.
- Kansas is one of only 7 states in the nation to have their state’s art agency in their economic development or commerce department. The most common set-up for state arts agencies is in the governor’s office or in the culture or tourism departments. Other states’ art agencies do not have the same economic development expectations as the commission, because they are outside of their commerce departments.
- Comparison states also provide a variety of programs that Kansas does not, including grants and funding to transport students to professional arts activities (2 states) and grants to support film and digital media productions that benefit small businesses and the state (Iowa).
Conclusion
The arts have the potential to generate both economic and non-economic benefits. At the state level, however, we found the current funding for and structure of the Arts Commission is not producing economic results. In part, that is because Kansas provides less funding for its state arts agency than any other states in the nation. As a result, the commission is only able to provide very small grant awards that produce little to no clear economic benefit for the state. Other states’ official arts agencies generally do not try to measure the economic impact of their state art agency efforts, even though they provide their agencies with significantly more funding. If policymakers want the commission to have a significant effect on the Kansas economy, considerable changes would be needed in how the commission is funded, staffed, and awards grants.
Recommendations
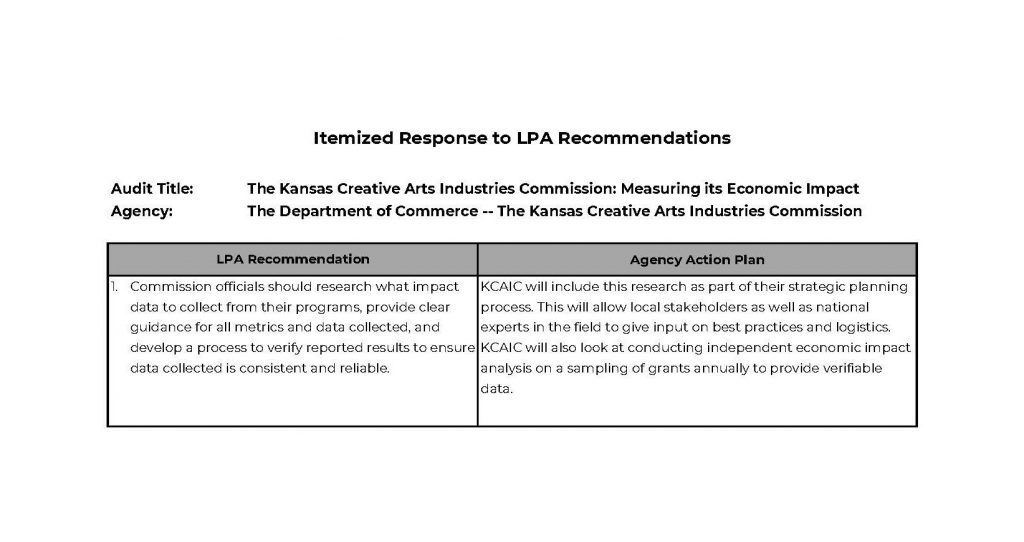
- Commission officials should research what impact data to collect from their programs, provide clear guidance for all metrics and data collected, and develop a process to verify reported results to ensure data collected is consistent and reliable.
- The Kansas Legislature should consider other non-EDIF funding sources for the commission, because the commission’s grants are currently too small to have a meaningful effect on the Kansas economy.
Agency Response
On February 18, 2020 we provided the draft audit report to the Department of Commerce and Kansas Arts Industries Commission. Their response is below.
Agency officials generally agreed with our findings and conclusions.
Appendix A – Cited References
This appendix lists the major publications we relied on for this report.
- Arts and Cultural Production Satellite Account, U.S. and States 2016 (March 2019). U.S. Department of Commerce Bureau of Economic Analysis.
- Best Practices in Carrying Out State Economic Development Efforts (2005). National State Auditors Association.
- The Creative Industries in the United States (2017). Americans for the Arts.
- State Arts Agency Revenues Fiscal Year 2019 (February 2019). National Assembly of State Arts Agencies.
- State Arts Agency Staffing Trends (2019). National Assembly of State Arts Agencies.
- State Fact Sheets (2019). National Endowment for the Arts.
Appendix B – Distribution of Grants Awarded
This appendix includes a map showing how the commission’s grant money awarded in fiscal year 2019 is distributed across the state.
Appendix C – Example of Grants Awarded
This appendix shows examples of recent grant projects the commission has awarded funds to.