Estimating the Cost of K-12 Education
Introduction
K.S.A. 72-5173 requires this audit, which the Legislative Post Audit Committee authorized at its December 12, 2022 meeting.
Objectives, Scope, & Methodology
Our audit objective was to answer the following questions:
- What is the estimated cost to K-12 school districts to educate all students to meet performance outcome standards set by the Board of Education?
- What does research say about the relationship between spending and outcomes?
For reporting purposes, we consolidated the questions and separated out the analysis related to special education students.
To answer the audit objectives, we collected and reviewed student and district-level data from the Kansas State Department of Education for the school years 2017-2022. We also collected data from the U.S. Census Bureau, the Kansas Bureau of Investigation, the Kansas Department of Corrections, and the U.S. Bureau of Labor Statistics. We used that data to create a logistic regression model to understand the relationship between regular educational spending and student outcomes. We went back several years to get a balanced mix of pre-and post-COVID assessment results. We also reviewed data from a selection of special education organizations and KSDE for the 2022 school year. We used that data to create a professional judgment model for special education. Last, we talked with stakeholders and reviewed academic literature to understand the factors that are important in predicting student outcomes. More specific details about the scope of our work and the methods we used are included throughout the report as appropriate.
We used two consultants to assist with the models in this report. Dr. Valerie Bostwick assisted with the regular education model. Dr. Bostwick is an Assistant Professor of Economics at Kansas State University. Larry Clark assisted with the special education model. Mr. Clark has 46 years of experience in special education as a school psychologist and director of a special education interlocal.
Important Disclosures
We conducted this performance audit in accordance with generally accepted government auditing standards. Those standards require that we plan and perform the audit to obtain sufficient, appropriate evidence to provide a reasonable basis for our findings and conclusions based on our audit objectives. Overall, we believe the evidence obtained provides a reasonable basis for our findings and conclusions based on those audit objectives.
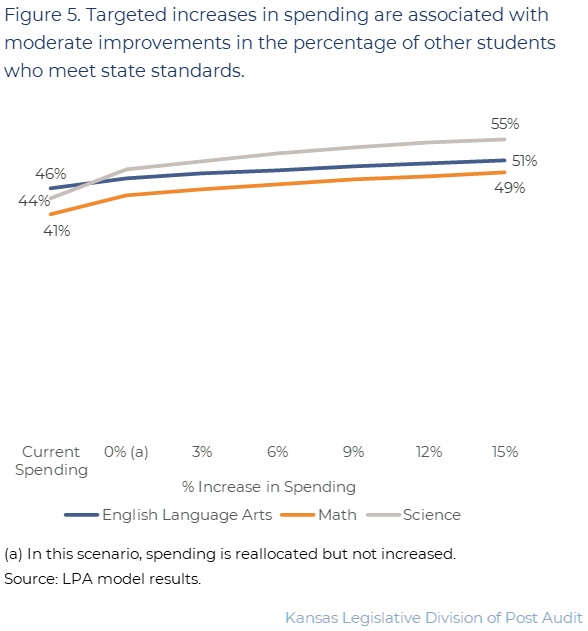
No amount of increased spending will result in all students meeting state standards, but targeted increases may improve some students’ outcomes.
Background
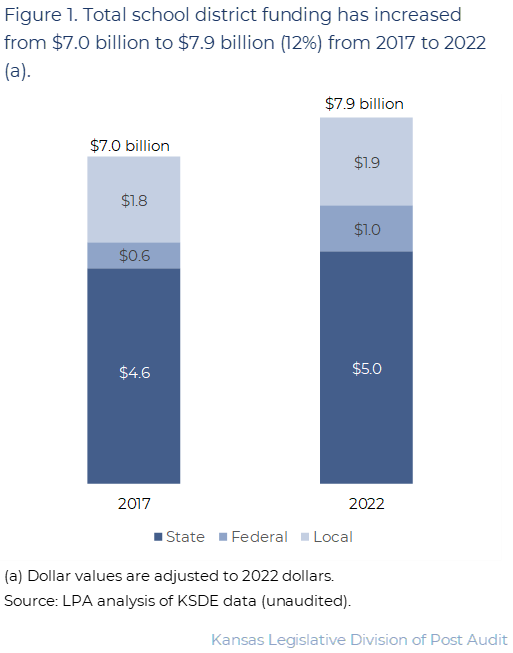
In 2022, Kansas school districts received $7.9 billion in funding from state, local, and federal sources, up 12% from 2017.
- The majority (64%) of funding school districts receive is from the state. In 2022, school districts received $5 billion ($10,400 per student) in state funds. The state provides funding to districts in several ways:
- It provides a flat amount of funding for each full-time-equivalent (FTE) student called base aid. In 2022, base aid was $4,706 per FTE student.
- The state provides an additional amount of funding for students that meet certain criteria. For example, districts receive additional funds for students that are eligible for a free lunch or take career and technical education courses.
- The state also provides additional money to districts that cannot generate as much money from local tax sources as other districts.
- Last, the state provides funding to cover a portion of districts’ special education costs.
- Districts also receive funding from local property taxes. Funding from local sources is capped at the statewide average of the district’s general fund. However, the district can pass a resolution to raise the cap to a maximum of 33% of the general fund. Local voters can also vote to pass bonds to pay for large construction projects in the district. In 2022, about $1.9 billion or 24% of total district funding was from local sources.
- Districts receive funding from the federal government as well. The federal government provides several types of funding including funds for disadvantaged students, special education, and reimbursements for students eligible for free or reduced lunches. Since 2020, the federal government has also provided funds districts can use to address issues related to COVID. In 2022, about $1 billion or 12% of total district funding was from the federal government.
- In Kansas, education funding has increased 12% since 2017. Much of that increase is due to significant increases in federal funding since 2020, as well as increases in state funding. Figure 1 shows how state, local, and federal funding changed from 2017 to 2022. As the figure shows, after controlling for inflation, total funding has increased from $7.0 billion to $7.9 billion.
Since 2017, public school enrollment has decreased, while staffing and spending have increased.
- From 2017 to 2022, Kansas public school enrollment declined from about 490,000 students to about 480,000 (a 2% decrease). The enrollment decline began in 2021 and is likely related to students leaving public schools for COVID-related reasons.
- From 2017 to 2022, enrollment trends related to certain groups of students have been mixed:
- The percentage of students receiving English as Second Language (ESL) services has decreased from 11% of students to about 9%. This is a decrease of about 12,000 students.
- The percentage of students who qualified for a free lunch has decreased from 39% of students to about 33%. This is a decrease of about 31,000 students.
- The percentage of students receiving special education services has increased from 17% of all students to nearly 19%. This is an increase of about 4,000 students.
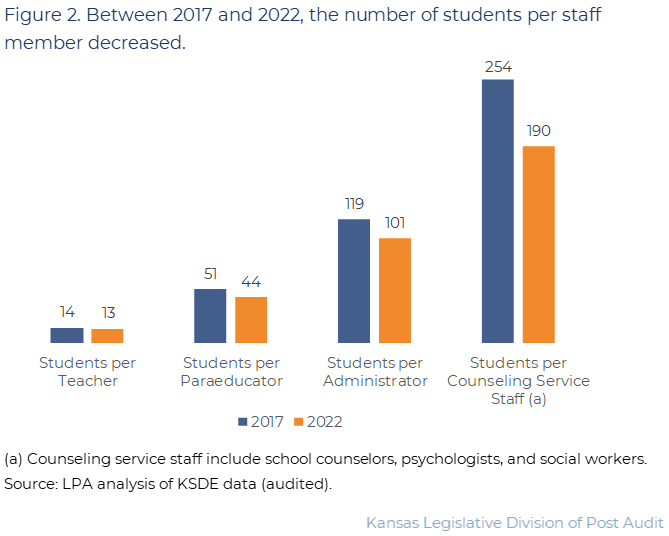
- From 2017 to 2022, the number of school district staff increased (from 68,000 to 73,000) although the number of students decreased. This resulted in a decrease in the number of students per staff member. Figure 2 shows the changes in students per various types of staff. As the figure shows, students per teacher changed slightly (from 14 to 13). However, the number of students per counseling service staff member declined more significantly (from 254 to 190). In some cases, a declining number of students per staff can be a positive trend because it means staff have more time to devote to each student.
- After controlling for inflation, spending per student has also increased 14% from 2017 to 2022. Spending per student has increased from about $14,400 to $16,400 since 2017. Additionally, total spending has increased from about $7.0 billion to $7.9 billion.
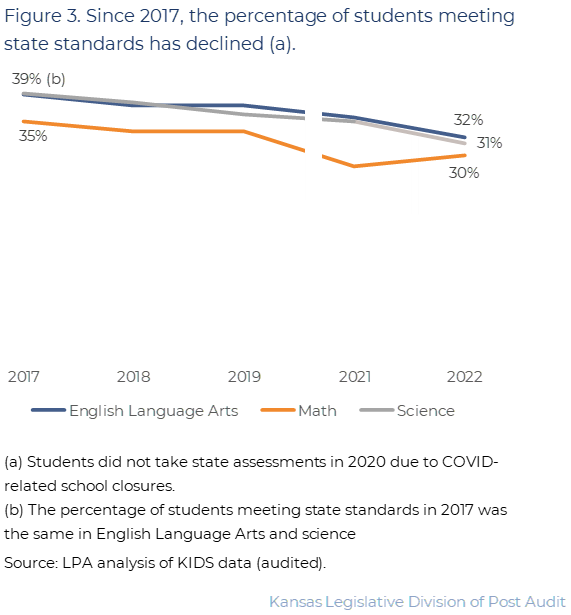
Only about 1/3 of students met state standards in the 3 subjects we evaluated, and the numbers have been declining since 2017.
- The Kansas Assessment Program is a series of standardized tests mandated by K.S.A. 72-5170. The assessments are designed to evaluate whether a student has mastered state standards. The program includes assessments for English language arts, math, and science.
- Students take assessments periodically from 3rd grade through 11th grade. Students take the English language arts and math assessments every year in grades 3 through 8 and in the 10th grade. Students take the science assessment in grades 5, 8, and 11.
- Student scores are placed into 1 of 4 performance levels for each test. We consider a student to be meeting state standards if they scored a 3 or a 4.
- Level 1: the student shows limited ability for postsecondary readiness
- Level 2: the student shows basic ability for postsecondary readiness
- Level 3: the student shows effective ability for postsecondary readiness
- Level 4: the student shows excellent ability for postsecondary readiness
Regular Education Model Results
It is unlikely that any amount of additional spending will result in all students meeting state standards because student outcomes are the result of many factors beyond spending.
- K.S.A. 72-5173 required us to estimate the costs of providing educational opportunities so that every public-school student in Kansas could achieve the performance outcome standards set by the State Board of Education.
- However, measuring opportunity is subjective and varies from student to student. Further, it is unlikely that all students will meet state standards even if provided the opportunity to do so. Not all students have the same academic abilities, motivation, or support at home to do well in school. Building a cost model that assumes a subjective and unreachable outcome will not lead to a reliable or realistic answer.
- Cost models that are built on the assumption that spending alone will lead to significant improvements may be too simplistic. Student outcomes are the result of a complex relationship between individual student traits, home environment, and district and school characteristics. It is difficult in these models to adequately capture that complexity. As a result, they often give an impression that increases in expenditures alone will always result in improved student outcomes. Further, research in this area is continually evolving and our understanding about what factors are important and what models are the most realistic is also changing.
- As a result of these things, we chose to create two different models that we think better reflect what is realistic. Our models do not produce a single number at which all students will meet state standards. This is because the research, and our previous experience with examining educational costs, does not support such a model. Instead, we did two things:
- We created a model that examined the relationship between regular education spending and outcomes. This model predicts how increases in spending could change student outcomes. As part of that model, we looked at the relationship between spending and outcomes for specific groups of students, including students who qualify for free lunches.
- We estimated the cost to provide special education services. This estimate assumes a minimum service level (enough resources for students to meet their individual education plan goals) but it does not assume that all students will meet state standards.
We used a logistic regression model to predict how increases in regular education spending might affect student outcomes.
- A logistic regression model predicts the odds of an outcome based on several variables. We used this type of model to estimate the probability that increased spending would improve state assessment scores. Specifically, our model used prior K-12 expenditures as a baseline for spending. Then, we increased expenditures in 3% increments (up to 15%) to measure its predicted impact on student outcomes. The results showed how a potential increase in spending might impact the percentage of students able to meet state standards. Our methodology is explained more in Appendix A.
- We used KSDE expenditure data from 2017 to 2022 as the basis for our analysis. We used the expenditure data to determine how spending affects student outcomes. However, we excluded spending unrelated to K-12 student outcomes, such as adult education and driver training.
- We used Kansas student assessment scores from 2017 to 2022 to evaluate how many students might meet state standards. We included three subjects in our analysis (math, English language arts, and science). Although students take a social studies assessment, the test was changed recently and could not provide a long-term comparison. We only used state assessment scores since 2017 because 2017 was the first year that students started taking the current state assessment.
- Our model incorporated data from several sources to control for as many other factors as possible. This included demographic data from the U.S. Census, incarceration data from the Kansas Department of Corrections, and student demographic data from KSDE. By incorporating other factors that might impact student success we can isolate the impact of spending. Further, it also allows us to understand what factors might have the largest impact on student outcomes. Detailed information about these other factors and our model is contained in Appendix A.
We ran several iterations of the model to understand how different spending strategies might impact different groups of students.
- We used our model to first determine which types of spending matter most to the percentage of students who meet state standards. We found that spending in a few categories, such as administrative salaries and support, were related to improved student outcomes. Conversely, spending related to categories such as property generally had little to no effect on student outcomes.
- We used our model to run two different spending scenarios. In both scenarios, we assumed that spending would increase from 3% to 15% per student. We stopped at an increase of 15% per student to preserve the reliability of our model. That range represents an estimated increase in total spending of $150 million to $650 million. However, how that money was spent is different in each model:
- One scenario assumed across-the-board spending increases. For example, if districts spent an additional $1,000 per student, that money would be spent across all categories of spending.
- The second scenario assumed that spending would be targeted to those categories that have the most impact on student outcomes. This includes spending in categories such as student support services and administration. This scenario assumed the same total increase in spending of up to 15%. However, the increase in spending would be targeted to specific spending categories. For example, if districts spent an additional $1,000 per student, that money would be spent in just a few categories (e.g. $500 in administration and $500 in student support). These spending increases are not targeted to specific types of students (e.g. at-risk or ESL students) only to specific categories of spending.
- We also evaluated how our two spending scenarios affected different groups of students. This included disadvantaged students and then all other students. Disadvantaged students included 3 groups of students:
- Students who are eligible to receive free lunches. In 2022, 33% of students were eligible for a free lunch.
- Students who receive ESL services. These are students who are not native English speakers and need assistance learning English. In 2022, about 9% of students received these services.
- Students who are both eligible for free lunch and are receiving ESL services. We estimated this was about 6% of students in 2022.
- We chose to evaluate disadvantaged students separately from other students because they tend to need more services. Further, even though districts spend more on these students, they do not perform as well on state assessments. For example, over the last several years, per-student expenditures ranged between $8,800 to $11,000 for disadvantaged students. That’s compared to $7,700 for all other students during the same time. These totals exclude certain expenditures such as driver’s education, food service, and adult education. However, only 9% to 21% of disadvantaged students met state standards in 2022. That’s compared to about 44% for all other students.
Across-the-board spending increases were associated with almost no increase in the percentage of students who met state standards.
- As mentioned previously, in this model we assumed spending increases of 3% to 15% per student were spread evenly among all categories of spending.
- We ran this model for both disadvantaged students and all other students, but neither showed a significant impact on outcomes. In this model, across-the-board spending increases of 15% in per-student expenditures (an estimated $650 million) were associated with very small increases in the number of students meeting state standards.
- For example, increasing expenditures for students who receive ESL services from $8,800 to $10,200 (15%), was associated with an increase of only about 100 students meeting state standards.
- For all other students, increasing expenditures from $7,700 to $8,900 (15%) was also associated with little to no change. For example, an increase in expenditures was associated with no change in the percentage of students who met standards in math.
- This spending scenario indicates that not every increase in spending has an impact on student outcomes. When spending is spread over all types of spending, some amount is spent on things that have little impact on student outcomes, such as operations and maintenance. Additionally, not enough may be spent on things that matter, such as teacher salaries. This can result in increased expenditures but no improvements in student outcomes.
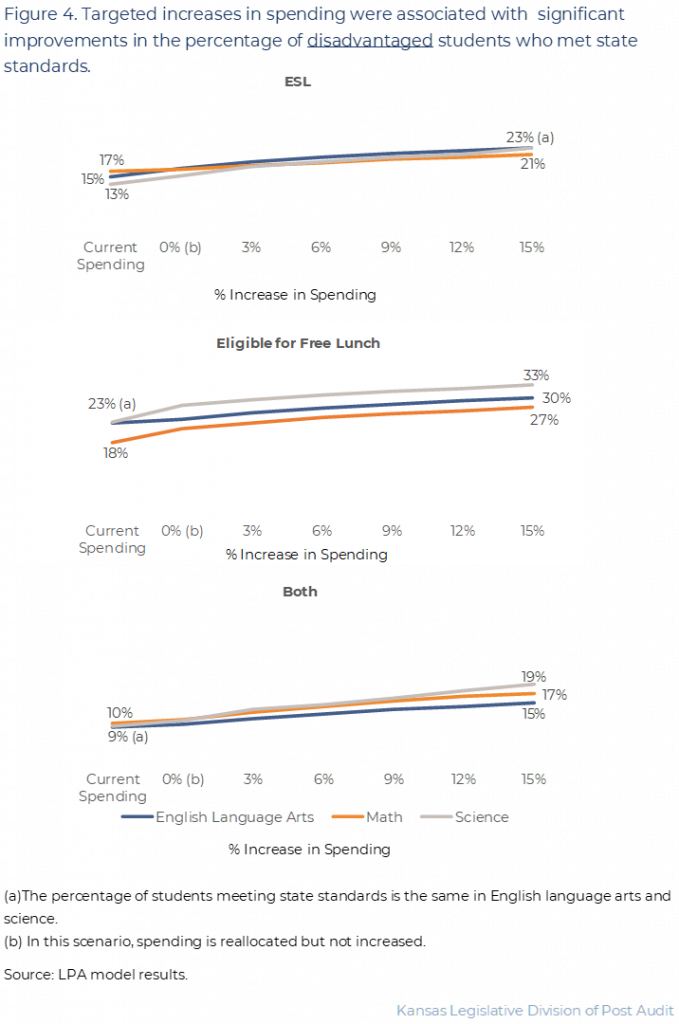
Targeted increases in spending were associated with improvements in the number of students who met state standards, but significant numbers of students would still be unlikely to meet state standards.
- Because across-the-board increases in spending were not associated with much improvement in the percentage of students who met state standards, we ran a second model. In this one, we assumed spending increases would be targeted to specific spending categories rather than across-the-board. For all 4 of the groups of students we evaluated, spending related to administration was associated with improvements in student outcomes. However, other spending categories were more inconsistent. For example, spending on property was associated with improvements for students receiving ESL services but not for the other groups.
- In this scenario, a targeted 15% increase in per-student spending was associated with moderate to significant improvements in the number of students who met state standards. On average, the number of disadvantaged students who met state standards increased by 43%. For other students, the number of students who met state standards increased by 17%.
- Despite significant increases in the number of students who met state standards, the percentage of disadvantaged students likely to meet state standards was still very low. Figure 4 shows the percentages of disadvantaged students who might meet state standards under targeted spending increases. As the figure shows, targeted spending increases were associated with improvements in the percentage of students meeting state standards. For example, the percentage of students receiving ESL services that met state standards in science improved from 13% to 23%. Despite these improvements, about 70% to 80% of disadvantaged students were still unlikely to meet state standards.
- Further, targeted increases in spending were associated with only about half of other students meeting state standards. Figure 5 shows the percentage of other students who might meet state standards under targeted spending increases. As the figure shows, the percentage of students who meet state standards improved in all 3 subjects. However, about half of these students still do not meet state standards.
- Much of the research we reviewed had similar findings. For example, one study noted that although spending matters, it does not matter in all circumstances. Other studies that we reviewed found disadvantaged students benefit more from increases in spending than other students. Further, a couple studies noted that how money is spent is an important factor in improving student outcomes. We describe the research findings in more detail later in the report.
- Given the limitations of our model, we cannot determine with precision how much additional spending it might take for disadvantaged students to perform more similarly to other students. However, it is likely to be an increase in per-student spending of at least 50% (an estimated $2.0 billion) Nevertheless, spending increases alone are unlikely to be enough to ensure that disadvantaged students meet standards at the same rates as other students. Further, no amount of spending can guarantee that all students will meet state standards.
We identified several factors, such as teacher pay and administrative spending, that were also associated with whether students met state standards.
- Based on our model, we found a few specific factors that were associated with better student outcomes. These factors provide insight on specific strategies that might improve assessment scores. Not all of these strategies require increased spending. Some could likely be achieved by reallocating existing spending. For example, increased teacher pay may not lead to overall increases in spending if it is accompanied with having fewer paraprofessionals. Each of these factors were associated with statistically significant improvements in the number of students who met state standards.
- Having fewer, better paid teachers may have a more positive impact than having more teachers who are paid less. Higher teacher pay was associated with more students meeting state standards. This is likely because higher teacher salaries may attract and retain higher quality teachers, which results in better outcomes over time. Additionally, higher student-to-teacher ratios (more students per teacher) were also associated with more students meeting state standards. The combination of these seem to indicate that students likely benefit from higher quality teachers even if class sizes are slightly larger. Some of the research we reviewed found a similar result and noted there is often a trade-off between the quantity and quality of teachers.
- Having fewer paraprofessionals and teacher aides compared to the number of teachers was associated with a greater percentage of students who met state standards. This may indicate that students benefit more when teachers deliver content than when paraprofessionals do.
- Spending on administrative activities was consistently associated with improvements in student outcomes. Spending on things that may improve the quality of district and building leadership appear to have a positive impact on students. However, the model does not indicate what type of administrative spending might be best (i.e. hiring more administrators versus improving the quality of existing administrators).
- Students who attend school in districts with higher average attendance rates tend to perform better than students in districts with lower average rates. This is not surprising but indicates that programs that encourage better attendance may increase the number of students who meet state standards.
- Increases in instructional spending were not associated with improved outcomes. Instructional spending includes things such as teacher salaries, books, and contracted services related to providing instruction. However, specific aspects of instructional expenditures, such as teacher pay, were associated with better outcomes. This may indicate that how districts spend money on instruction is more important than increases in overall instructional spending.
There are a few important caveats to the results of our spending model.
- Increases in spending cannot guarantee improvements in student outcomes. Our model only allows us to determine what variables are related to improvements in student outcomes. Finding a relationship does not indicate that one caused the other. As a result, it should not be assumed that increases in spending will always lead to improvements in outcomes.
- Because of the many factors that influence student outcomes, we cannot control for all of them. We have controlled for as many of the important factors as we can such as poverty and parent education levels. However, we cannot control for some factors including student motivation, the specifics of a student’s home life, or instructional quality.
- Our model does not differentiate between increased spending through more funding or by re-allocating existing funds. Districts can increase spending in specific categories in 1 of 2 ways. Districts can reallocate existing funding by spending less in one area and redirecting that money to another area. Alternatively, a district may increase spending because it received more funding. Most likely, districts can increase spending to a small degree by reallocating funds. However, more significant increases are likely to require new funding. The model does not indicate which strategy is best.
- Current funding mechanisms do not target funding to specific spending categories. Most funding is general (i.e. base state aid) or related to students who meet specific characteristics (i.e. free lunch or special education). As a result, it is the districts’ responsibility to direct funding to specific spending categories.
Research Findings
Much like our own model, the research we reviewed found a positive relationship between spending and outcomes but it was not strong in all circumstances.
- We reviewed literature that studied the relationship between spending (or funding) and outcomes. This literature review answers one of our audit objectives but also informed our regular education model. Further, many of the conclusions we noted in this literature review are similar to what we found in our own model.
- We reviewed 8 literature reviews, meta-analyses, and studies examining the relationship between spending or funding and student outcomes. The studies looked at a variety of outcomes such as assessment results and graduation rates. Further, the research included both nationwide and state-specific studies.
- 7 of the 8 studies concluded that spending has at least some impact on outcomes. For example, one study found that increases in per-student funding had a positive impact on test scores, graduation rates, and college enrollment. Another noted that 12 of the 13 multi-state studies they reviewed found positive and statistically significant relationships between spending and outcomes. Only 1 of the 8 studies found no statistically significant relationship between spending and outcomes.
- However, when looking at single state studies, the results are more inconsistent. 7 of 20 single state studies included in one literature review found no significant relationship (the other 13 found a positive relationship). For example, a study from Michigan found that 27 of the 28 academic indicators it studied showed no statistically significant relationship between spending and student performance. This inconsistency led one study to conclude that even if spending matters on average, it does not matter in all settings or in all contexts.
- Additionally, spending may impact different types of students in different ways. A few studies noted that increased or decreased spending had a greater impact on disadvantaged students. For example, one study found that for students from low-income families, increasing per-student spending led to large improvements in educational attainment. However, for children from non-poor families, the effects were significantly smaller.
- A few studies noted the importance of understanding which spending improves outcomes. One noted that understanding what kinds of spending increases matter the most is still an open question. Additionally, a couple studies noted that adding more resources without addressing how the money will be spent will not ensure improvements in student outcomes.
Research suggests spending on teacher pay, books, and time in class may improve student outcomes.
- We reviewed 9 studies looking at what types of spending are related to improved student outcomes. Although we found a number of such studies, these studies do not all speak to which spending is the most important for improving outcomes. Further, only one examined what types of spending were the most cost-effective. There appears to be little current research that might fully answer those questions.
- A number of studies indicated that spending that improves the quality of teachers may be an effective way to improve student outcomes. The research we reviewed found several important things about teachers and student achievement:
- One review included 9 studies that focused on professional development for elementary school teachers. Across those studies, teachers that had 14 hours or more of professional development annually had a significant positive effect on student achievement.
- One study found that improving teacher quality was more strongly related to student outcomes than reducing class size.
- Another noted that, in the long run, higher teacher salaries may attract more high-quality teachers to the profession. In turn, this may improve student outcomes.
- Other types of spending may also have positive impacts but the improvements appear to be more marginal:
- One study found increased spending on textbooks has a small impact on student outcomes.
- Another study found time spent in class can improve student achievement. However, this improvement was only seen in high-quality classrooms. Students in classrooms deemed to be low-quality did not see any improvements with increased time. Low-quality classrooms were defined as classrooms where student learning was hindered. This included classrooms with student behavioral problems or poor interactions between students and teachers.
- The benefits of capital spending were mixed. One study indicated that capital spending did not generate improvement in student achievement. However, another found that that increases in capital spending can lead to small improvements over time. The effect of those improvements was significantly less than improvements related to non-capital spending.
- We also spoke to several stakeholders to gather their opinions about what type of spending has the most impact on student outcomes. We talked to 7 organizations including school districts, the Kansas National Education Association, and United School Administrators. Every stakeholder we talked to told us that spending on educators has the most direct impact on outcomes. This included spending on professional development and increased teacher pay. Some stakeholders also suggested that spending on curriculum and early childhood education would have an impact on student achievement.
For special education, we estimated the total cost for students to meet the goals in their individualized education plans to be between $1.2 and $1.5 billion annually.
Special Education Results
We estimated how much it would cost to provide special education services in Kansas.
- As part of our objective, we were asked to determine how much it costs for all students to meet state standards. For reasons discussed previously, we chose to use a spending model to understand regular education outcomes. However, for special education we chose to use a cost model that estimates the cost to deliver a specific amount of services. We did this for a couple reasons:
- Reasonable expectations for special education student outcomes vary and are highly individual. For some students, meeting state standards is not a reasonable expectation. Further, the type of outcome that might be appropriate varies from student to student. For some students it might be recognizing more letters or improving basic math skills. For others, it might be learning how to be more independent or regulating their behavior better. As such, it is not reasonable to measure student outcomes by a single metric that may not be possible for some students.
- We lacked the detailed expenditure data necessary to run a spending model. Many school districts contract with other organizations to operate their special education programs. We did not have detailed expenditure data for all of those organizations.
- Our estimate is based largely on an input-oriented professional judgment approach. This means the cost estimates reflect resource levels that organization officials, research, and a consultant suggested were optimal to help students achieve their individualized education plan (IEP) goals. All students who receive special education services are required to have an IEP. This plan details what their goals are and what services special education organizations will provide to help them achieve them.
- We collected detailed data from 14 special education organizations (out of 74) related to staffing, the amount of time spent on various tasks, expenditures, and the challenges of hiring special education staff. We used that data to calculate what various staff, materials, and other activities typically cost. The 14 organizations included cooperatives, interlocals, and districts that provide special education services independently. They represent a reasonable cross-section of Kansas special education organizations.
- We also utilized a consultant and current research to help us determine appropriate staffing levels. Our consultant has 46 years of experience in special education. Further, he was recommended by KSDE and the Kansas Association of Special Education Administrators. We consulted current research to understand the most optimal ways to provide special education services. Specific details about resource levels can be found in Appendix B.
In the 2021-22 school year, Kansas school districts provided special education services to about 88,400 children.
- Federal and state laws require school districts to offer special education services. The federal Individuals with Disabilities Education Act requires states to provide special education services to children with disabilities between the ages of 3 and 21. In Kansas, K.S.A. 72-3404 augments the federal law by including gifted children in special education as well.
- School districts are responsible for providing appropriate special educational services to their students. Districts have a few options for providing these services, including:
- A district can independently provide special education services using their own teachers or contracting for services. In the 2021-22 school year, 33 districts independently provided special education services to about 45,000 students.
- A district can join a special education cooperative. A cooperative is administered by a “sponsoring” district. The sponsoring district arranges for the provision of services among all its members. In 2021-22, 24 cooperatives provided special education services to about 25,000 students.
- A district can join an interlocal. An interlocal is managed by a separate entity. Each member district has a seat on the board of the interlocal. The interlocal hires various staff and ensures that services are provided to students within the member districts. In 2021-22, 17 interlocals provided special education services to about 19,000 students.
- Districts, cooperatives, and interlocals provide a variety of services to students who qualify for special education. Students who receive special education services have a wide variety of needs. Some may only need speech and language services for a year or two to correct a speech impediment. Other students may need assistance from a paraeducator for their entire academic career. Students may also need services such as physical therapy, occupational therapy, or counseling for significant periods of time. Last, some students may require special buses to bring them to school or technology assistance to help them communicate. Districts are required to provide any service the child needs to fully access their education.
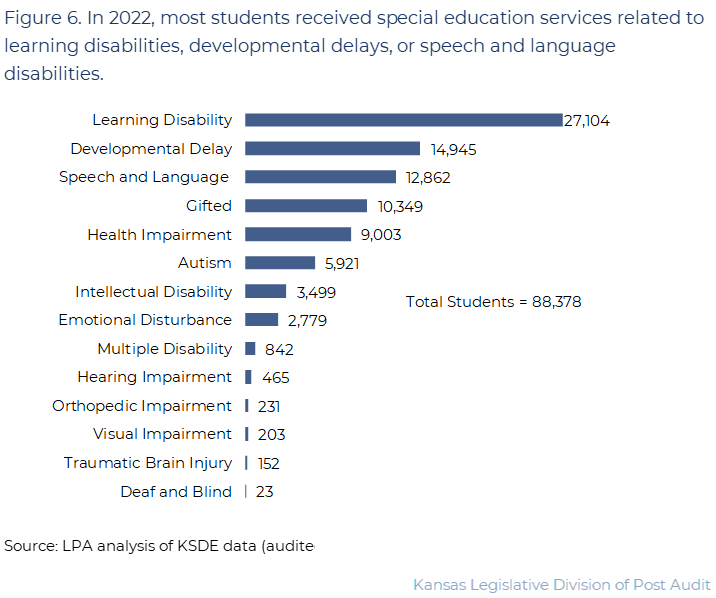
- In the 2021-22 school year, districts provided special education services to about 88,400 students. Figure 6 shows the number of students who received special education services in 2022 by exceptionality. As the figure shows, in 2022, most students received services related to learning disabilities, developmental delays, or speech and language disabilities.
- Last, in the 2021-22 school year, districts spent about $1.2 billion to provide special education services. The Legislature provided $513 million in special education funding. The remainder was paid for with other state funds and local and federal funding.
We estimated it would cost a total of $1.2 billion to $1.5 billion annually to provide special education services that would allow students to meet their IEP goals.
- We estimated a range of costs because student needs vary significantly. The range reflects different assumptions about the intensity of the services students might need. The low-end estimate assumes that most students have moderate needs and therefore receive a moderate amount of services. However, our high-end estimate assumes students have much more significant needs. In reality, needs vary across the student population so costs are likely somewhere in between the two estimates.
- The estimate only includes the “additional” costs of special education to school districts. Although regular education resources are sometimes used in special education, we only included costs incurred as a direct result of special education. For example, a 3rd grade teacher might assist in writing an IEP. We did not consider the 3rd grade teacher a special education cost because the teacher will be hired to teach 3rd grade regardless of special education. Additionally, our estimate does not include costs related to the Kansas Public Employees Retirement System (KPERS). We estimated the cost to the districts to deliver special education services. The employer portion of KPERS is paid in full by the state. As such, we did not include it in our estimate.
- We estimated it costs a total of $1.2 billion to $1.5 billion annually to provide special education services. Those costs are allocated across various categories:
- Instructional costs ranged from $753 million to $952 million. This includes costs such as salaries and benefits for special education teachers and paraeducators, training, and instructional materials for students.
- Student support costs ranged from $334 million to $489 million. This includes costs such as salaries and benefits for physical therapists, student transportation, and assistive technology.
- Administrative costs were about $60 million in both models. This includes costs such as salaries and benefits for directors and office staff, office supplies, and mileage costs.
- Operational costs ranged from $20 million to $26 million. This includes costs such as salaries and benefits for maintenance staff, capital outlay costs for transportation, and utilities.
- In the 2021-22 school year, special education organizations spent about $1.2 billion or about $13,400 per student. In comparison, our model estimated it costs between $13,200 and $17,300 per student to meet IEP goals.
- Although districts are spending an amount similar to the low end of our estimated cost range, this does not necessarily mean that students are receiving the services in the quantity and quality they need.
- If districts deliver services in inefficient or ineffective ways, expenditures could be high even if students are not receiving appropriate services.
- Our cost estimate is tied to students receiving the services they need to meet their IEP goals. However, If IEP goals are not sufficient for ensuring positive outcomes, then spending an amount similar to our estimated cost may not result in positive outcomes. It was not in the scope of this audit to evaluate whether students receive the services in their IEPs or whether those services are appropriate.
Our special education estimate has a few important caveats related to staffing and efficiency.
- The estimate is based on more staff than special education organizations can likely currently hire. The estimate assumes between 2,000 and 10,000 more teachers, paraprofessionals, and related service staff than districts have currently hired. All 14 of the organizations we collected information from told us they have difficulty hiring at least some types of special education staff. As a result, the type of staffing levels in our estimate may not be currently possible.
- The way our model assumes services would be delivered may not be the way districts are currently delivering services. For example, our model assumes that special education organizations employ their own staff with minimal need for contracting or sharing resources. Currently, districts appear to use a variety of methods to deliver services including sharing, contracting with service centers, and providing services virtually.
- Our estimate is likely slightly understated because we assumed more efficiency than can actually exist in special education. Special education organizations must provide all services outlined in a student’s IEP regardless of cost. Sometimes students have specific needs that are expensive and cannot be delivered in an efficient manner. For example, a student who can only be on a bus for a very short amount of time may have a route dedicated to them. This is not very efficient but it may be necessary. We accounted for some of the costs associated with these inefficiencies but may not have accounted fully for them.
- We did not include costs related to capital expenditures for buildings. A few districts maintain buildings dedicated to special education. Additionally, a district may occasionally add classrooms or make other significant alterations to accommodate special education students in a regular education building. We collected information from 20 districts and found that these expenditures are rare and inconsistent from year-to-year. Further, district expenditure data is not maintained in a way that allows us to determine what they may be. As a result, we did not include them in our model. Due to the inconsistent nature of these expenditures, it likely has only a very small impact on our estimates.
Conclusion
The results of our model indicate that general spending increases are unlikely to significantly improve student outcomes. This is because not all spending has the same impact on students. Increased spending in areas that are most associated with student outcomes may have a moderate to significant impact on the number of students who meet state standards. However, even this targeted spending approach appeared to fall far short of closing the achievement gap and leaves significant numbers of students not meeting state standards. It is likely that strategies beyond just spending more money are needed to give Kansas schoolchildren the best chance at academic success.
Recommendations
We did not make any recommendations for this audit.
Agency Response
On September 22, 2023 we provided the draft audit report to the Kansas Department of Education. Its response is below. We reviewed the information KSDE officials provided but did not change our findings or conclusions.
- KSDE noted that the CPI has increased about 20% over the time frame we evaluated. We did not make any changes because as the report states, we have accounted for that inflation in our funding and spending figures.
- KSDE noted that classrooms that have more disadvantaged students tend to have more paraprofessionals and aides. This may be true, but in our model, we have controlled for a variety of metrics related to poverty and the number of disadvantaged students. As a result, even after we control for these things, we still found that having fewer paraprofessionals compared to the number of teachers was associated with better assessment scores.
- KSDE noted ”LPA found that better-paid teachers and sufficient levels of spending for administrative activities will lead to improvement…” This is not accurate. Our model can only describe what factors are associated with improvement. Increased spending in these areas cannot guarantee improvements.
Kansas Department of Education
Thank you for the opportunity to review the recent performance audit, Estimating the Cost of K-12 Education. The Kansas State Department of Education (KSDE) appreciates the opportunity to respond to the findings in the report.
The report sets as one objective to examine what the estimated cost to K-12 school districts is to educate all students to meet performance outcome standards set by the Board of Education. While there are multiple performance outcomes set by the State Board, The Kansas Legislative Division of Post Audit focused only on state assessment results.
LPA considers a student to be meeting state standards if they score at Level 3 or Level 4 on a state assessment. It’s important to understand that Level 2 performance is defined as the student showing a basic ability to understand and use the skills and knowledge needed for postsecondary readiness.
Ninety-four percent of students scoring at a Level 2 on state assessments graduate from high school on time, and more than 50% go on to pursue postsecondary education.
While we agree that state assessment results need to improve, KSDE’s priority must be to move more students out of Level 1, which districts are actively pursuing. Three of the six years’ worth of assessment data reviewed for the study was impacted by the COVID-19 pandemic. We expect results to improve beginning with the 2023 assessment data.
In addressing costs, the report notes that funding has increased by 12% since 2017. The increase has certainly been beneficial for school districts however it should be noted that the Midwest CPI over that same period of time increased by 20.3%. In addition, as noted in the report much of the increase is attributable to federal funding, a significant portion of which is due to the pandemic and will expire by September 30, 2024. This upcoming decrease will certainly impact school districts’ planning as they move forward.
The study found that those classes/environments with more paras and teacher aides had fewer students that met state standards. These are the classrooms that typically have more disadvantaged students. LPA chose to evaluate disadvantaged students separately from other students because these students tend to need more services, and they found that these students generally do not do as well on state assessments. Removing paras and aides from classrooms in which a student needs additional supports would most likely cause a decrease in test scores.
The regression model implemented by LPA found that an increase in targeted per-student spending led to a 43% increase in the number of disadvantaged students who met state standards. They added that “Given the limitations of our model, we cannot determine with precision how much additional spending it might take for disadvantaged students to perform more similarly to other students. However, it is likely to be an increase in per-student spending of at least 50% (an estimated $2.2 billion)”
These last two statements combined with the 2% increase in the number of special education students cited earlier in the study are of particular concern for school districts given the shortfall in statutory levels of both federal and state aid for special education.
The report indicates that student outcomes are the result of many factors, both within and outside the control of the school, stating, “Student outcomes are the result of a complex relationship between individual student traits, home environment, and district and school characteristics.” However, the report concludes that it is unlikely that any amount of additional spending will result in all students meeting state standards.
It must be clarified that this is not the same conclusion as stating that additional spending will not impact most students. In fact, LPA found that better-paid teachers and sufficient levels of spending for administrative activities will lead to improvement in student outcomes. Additionally, seven of eight studies reviewed by LPA for this report concluded that spending does have an impact on outcomes.
Finding that spending has an impact on student outcomes is consistent with prior studies directed by the legislature. In a 2006 study, Legislative Post Audit made the following statement; “We found a strong association between the amount districts spend and the outcomes they achieve.In the cost function results, a 1.0% increase in district performance outcomes was associated with a 0.83% increase in spending—almost a one-to-one relationship. Thismeans that, all other things being equal, districts that spent more had better student performance.”
Similarly in a March 2018 study, Estimating the Costs Associated with Reaching Student Achievement Expectations for Kansas Public Education Students, West Ed concluded: “… the analysis finds a strong, positive relationship between educational outcomes and educational costs, once differences in scale, need and price are taken into account. Consider first the Conditional NCE scores. The estimation indicates that a one percentage point increase in academic performance is associated with a 5 percent increase in cost. Similarly, a one percentage point increase in the graduation rate is associated with a 1.2 percent increase in cost at lower grades and a 1.9 percent increase in cost at the high school level.”
While LPA references the limitations of its model, the inescapable conclusion from this study and others is that spending clearly matters for improving student outcomes.
Sincerely,
S. Craig Neuenswander, Ed.D.
Deputy Commissioner
Kansas State Department of Education
Appendix A – Regular Education Detailed Methodology
This appendix includes a detailed methodology for the regular model we used to understand the relationship between spending and student outcomes.
We used a combination of student-level data, school district data, and county data in our model.
- We used student-level data from KSDE. This included student demographic data and state assessment scores for the 2017, 2018, 2019, 2021, and 2022 school years. Students did not take state assessments in 2020 due to COVID-related school closures.
- We also used school district data from KSDE. This included overall district metrics and demographic data, such as attendance rates and the percentage of students who receive free lunch. This data covered the 2017, 2018, 2019, 2021, and 2022 school years.
- We also used detailed district expenditure data from KSDE. We used this data to create 11 categories of spending that we used as different variables in the model. These categories included:
- (1) instruction salaries, (2) student support salaries, (3) instruction support salaries, (4) administrative salaries, (5) operations and maintenance, (6) instruction supplies, (7) support and administrative supplies, (8) property, (9) contracted instruction services, (10) contracted support and administrative services, (11) other.
- We also acquired county data from the 2020 Census and other sources. Before we could use this kind of data in our model, we had to first tie it to school districts so we could then tie it to students. To do this, we employed formulas and software that used the overlapping area and size of counties and school districts to convert county-level data to estimates of the same data within districts.
- Records were assembled on a per student, per assessment basis. For example, if student A attended District X in 2019 and took an ELA and math test that year, then Student A would have two different test records for 2019. These records would incorporate student A’s demographic and test data from 2019 along with the 2019 data from District X. In total, we had over 3 million individual records from 2017-2022.
In order to account for varying statistical effects, we split the records into 12 groups based on student need and assessment type.
- Some variables can have differing effects depending on the values of other variables. In statistics, these are typically referred to as interaction effects. To account for these, one can either add more variables that combine the effects of singular variables, or one can split the data up into separate groups based on the values of these variables.
- For this audit, we hypothesized that the effects of some variables would likely be different for students of different needs (at-risk, ESL, both, or neither) and for different test types (ELA, Math, and Science). Because we had millions of records, we decided to split the data up into 12 different groups based on each of the student need and test type combinations.
- The largest group was other students taking the ELA test, with about 738,000 records. The smallest group was students who receive ESL services taking the science test, with about 13,000 records.
We used multiple logistic regressions to model the relationship between student assessment scores and district expenditures after accounting for many other variables.
- A logistic regression model is a type of statistical model that takes a series of input variables and uses them to predict a binary outcome variable. The model can also tell us which variables were statistically significant in predicting the outcome. For this audit, the outcome variable was whether or not a student met state standards by scoring at level 3 or 4 on the state assessment.
- Some of the variables used to build the models were variables of interest (e.g., the expenditure categories) but most of the variables were control variables (e.g., district size, percentage of students who are free lunch, incarceration rates, etc.). A “control” variable in this context is a variable included in the model to control for the effect it has on the outcome. By including other variables that might impact the outcome, we can be more confident that the effects we see in the variables of interest are valid. We controlled for variables such as eligibility for free lunch, average household income in the district, and various district staffing levels.
- Prior to building the models, we split each of the 12 student groups into 2 distinct sets: a “training” set and a “test” set. About 96% of students from each of the 12 groups were randomly assigned to the training set of their group, while the remaining 4% were assigned to the test set.
- The training set is the data that is fed into the model to build it (also known as “training” the model).
- The test set is the data that is withheld from the model during training. This data is withheld so that it can be used to make an unbiased estimate of the model’s accuracy when predictions on brand new data are made.
- For each of the 12 student groups described above, we used statistical software to develop a logistic regression model from the training set data.
We used the models to estimate how spending changes under two different scenarios would impact the percentage of students meeting state standards.
- In the first scenario, expenditure increases were across-the-board, so that each of the 11 categories would increase by the same percentage. This represents a spending scenario where school districts spend in the same proportions as they currently do.
- In the second scenario, school districts slightly redistributed spending and targeted increases toward the spending categories that had a positive impact on student outcomes (positive coefficient). This was done by first reducing no-impact or negative-impact spending categories by 5%, then distributing that money evenly among the positive-impact categories. For spending increases, the additional money was distributed only among the positive-impact categories.
- For each of the 12 models, we compiled the coefficients to make a predictive equation. Using only the data in the test sets, we made our estimates by adjusting the spending variables to reflect the hypothetical changes in spending. The subsequent calculations resulted in a probability estimate for each student (from 0% to 100%) as to whether or not they would meet standards.
- In order to determine a cutoff percentage for classifying students as either meeting standards or not, we used the data in the training sets. We adjusted the percentage threshold until the proportion of students predicted to meet standards was roughly equivalent to the actual proportion. These thresholds were then used for our final estimates with the test sets.
Appendix B – Special Education Staffing Levels
This appendix includes detail about the staffing levels we used in the special education model. To determine how many teachers, paraprofessionals, related service staff, and indirect services staff were necessary we reviewed literature, collected opinions from 14 special education organizations, and requested feedback from our consultant. About 90% of the total estimated costs are related to salaries and benefits for staff. Staffing levels in our model were based on the following things:
The student to special education teacher ratio was based on literature and the number of teachers the 14 organizations we collected data from told us was optimal for their organization.
- The low end of our estimate set one special education teacher for every 14 students. This was the average ratio that the 14 organizations reported would be optimal. Our consultant confirmed this was reasonable.
- The high end set it at 1 teacher for every 8 students. This was based on the average student to teacher ratio that several studies found to produce the best outcomes in special education.
- Both ratios result in a number of teachers that is close to the number of teachers a Vermont study found to be “healthiest”. That study found that schools with one special education teacher for every 50 to 79 total students reported they had the resources they needed to adequately provide services. Under our model, Kansas schools would have 1 special education teacher for every 51 to 85 students (in 2022, it was 1 teacher per 93 students).
The student to paraprofessional ratio was also based on literature and the number of teachers the 14 organizations we surveyed told us was optimal.
- The low end of our estimate set 1 paraprofessional for every 6 students. The high end was set at 1 paraprofessional for every 7 students.
- In the model, we paired the lower number of paraprofessionals with the higher number of teachers and the higher number of paras with the lower number of teachers. We did this because the literature we reviewed described 2 different strategies for staffing special education. One provides more paraprofessionals in lieu of fewer special education teachers. The other provides more special education teachers but fewer paraprofessionals. It is not clear which model produces the best student outcomes. As a result, we used both staffing strategies in our model.
Related service staffing was based on the number of staff it would take to provide the services that students with different types of exceptionalities need.
- Related service staff include staff such as physical therapists, occupational therapists, and speech pathologists.
- Based on IEPs and our consultant we determined a range of services students with different types of exceptionalities typically require. From that, we determined how many staff it would take to provide those services for the state’s nearly 88,400 SPED students. We also considered the amount of time those staff spend on other tasks such as performing student evaluation and assisting with IEPs.
Indirect service staffing was based on what the 14 special education organizations we surveyed told us they needed and our consultant’s feedback.
- Indirect service staff are staff who work with teachers and other staff but do not typically work directly with students. These staff include staff such as behavior interventionists and assistive technologists.
- We set ratios based on the type of staff such as 1 instructional support staff per 20 teachers and 1 assistive technologist for every 75 staff.