Reviewing Community College Athletic Programs and Scholarships
Introduction
Representative Kristey Williams requested this audit, which was authorized by the Legislative Post Audit Committee at its April 22, 2022 meeting.
Objectives, Scope, & Methodology
Our audit objective was to answer the following questions:
- How much did community colleges spend on athletic programs and scholarships in recent years and what were the sources of those funds?
- Where are community college athletes from, how many have received scholarships, and how has this changed in the last 5 years?
For reporting purposes, we combined questions in the original audit proposal. We also shortened the period we reviewed to 5 years from 10 years due to a lack of available historical data.
We reviewed aggregate expenditure data and detailed student-level data for Butler, Garden City, and Hutchinson Community Colleges over a 5-year period from fiscal year 2018 to fiscal year 2022 to answer the questions. We chose these 3 colleges because each offers the major sports programs and has a large number of student athletes.
For these colleges, we talked to officials and reviewed athletic department and scholarship expenditure data and compared funding sources and spending over time. We also looked at student-level data to determine where student athletes were from and what their scholarship status was during this 5-year period.
Finally, we also reviewed publicly available data on athletic program expenditures and student athlete residency in fiscal year 2021 for all 21 colleges competing in the Kansas Jayhawk Community College Conference (KJCCC).
More specific details about the scope of our work and the methods we used are included throughout the report as appropriate.
Important Disclosures
We conducted this performance audit in accordance with generally accepted government auditing standards. Those standards require that we plan and perform the audit to obtain sufficient, appropriate evidence to provide a reasonable basis for our findings and conclusions based on our audit objectives. Overall, we believe the evidence obtained provides a reasonable basis for our findings and conclusions based on those audit objectives.
Our audit reports and podcasts are available on our website (www.kslpa.org).
The 3 community colleges we reviewed spent an average of $2.8 million annually in college funds such as student tuition, fees, public sources of funding, and other income on athletic departments, and $1.2 million annually in student fees and private funds on athletic scholarships from fiscal year 2018 to fiscal year 2022.
Background
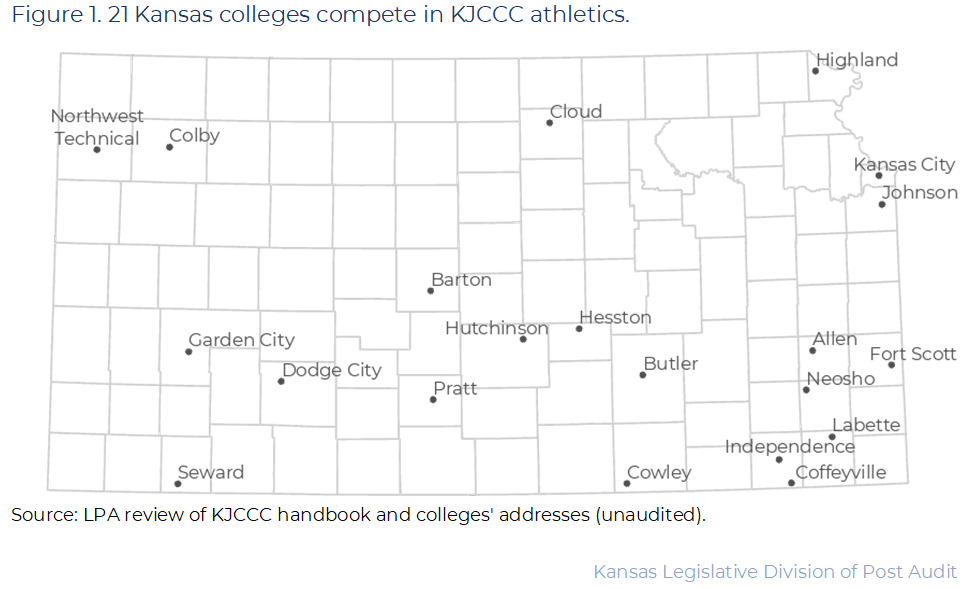
21 colleges in Kansas participate in Kansas Jayhawk Community College Conference (KJCCC) athletic programs.
- KJCCC colleges are distinct government entities separate from the state’s regent universities. They are not governed by the Kansas Board of Regents. The 19 community colleges are governed by locally elected boards of trustees. Both the technical and independent colleges are governed by appointed boards.
- Each college has athletic programs. Community college officials told us that athletic programs primarily exist to create access and educational opportunities for students. Athletic programs build comradery and a sense of belonging among students and provide opportunities for student involvement. They also increase colleges’ visibility in their communities and to potential students and can lead to increased enrollment and revenue.
- The KJCCC includes 21 colleges—19 community colleges, 1 technical college, and 1 private, independent college. Figure 1 shows the colleges on a map. As the map shows, these colleges are spread across the state.
- The 21 colleges in the KJCCC reported a total of about 93,000 students enrolled in fiscal year 2021. 83% of those students were Kansas residents. The remaining 17% of students were residents of other states or countries.
The NJCAA limits the amount and type of athletic scholarships colleges can offer.
- The KJCCC is a conference under the National Junior College Athletic Association (NJCAA). Colleges must follow guidelines set by the NJCAA to take part in conference and national-level athletic competitions.
- Colleges choose which sports to participate in and whether to compete in division I, II, or III for each sport. The division determines the maximum scholarships colleges can offer to their student athletes. Community college officials told us scholarships awarded are often less than the allowable amount.
- The NJCAA allows athletic scholarships for division I sports to at maximum include tuition and fees, room and board, course books, up to $250 in course-related supplies, and limited transportation costs. For athletes competing in division II sports, colleges can offer tuition and fees, course books, and up to $250 in course-related supplies. There are no athletic scholarships for student athletes competing in division III sports.
- Schools also can have student athletes who do not receive athletic scholarships. However, these athletes may receive non-athletic scholarships such as scholarships for academic merit. The focus of this audit is limited to athletic scholarships.
Colleges use a variety of funding sources to pay for athletic departments and scholarships.
- Colleges receive funding from the federal and state governments, local property tax revenues, private contributions from booster clubs or donors, student tuition and fees, and other revenue. Not all colleges receive funding from all sources. Student fees are fees that pay for instructional costs and non-instructional costs like activities, services, scholarships, and educational programming for students.
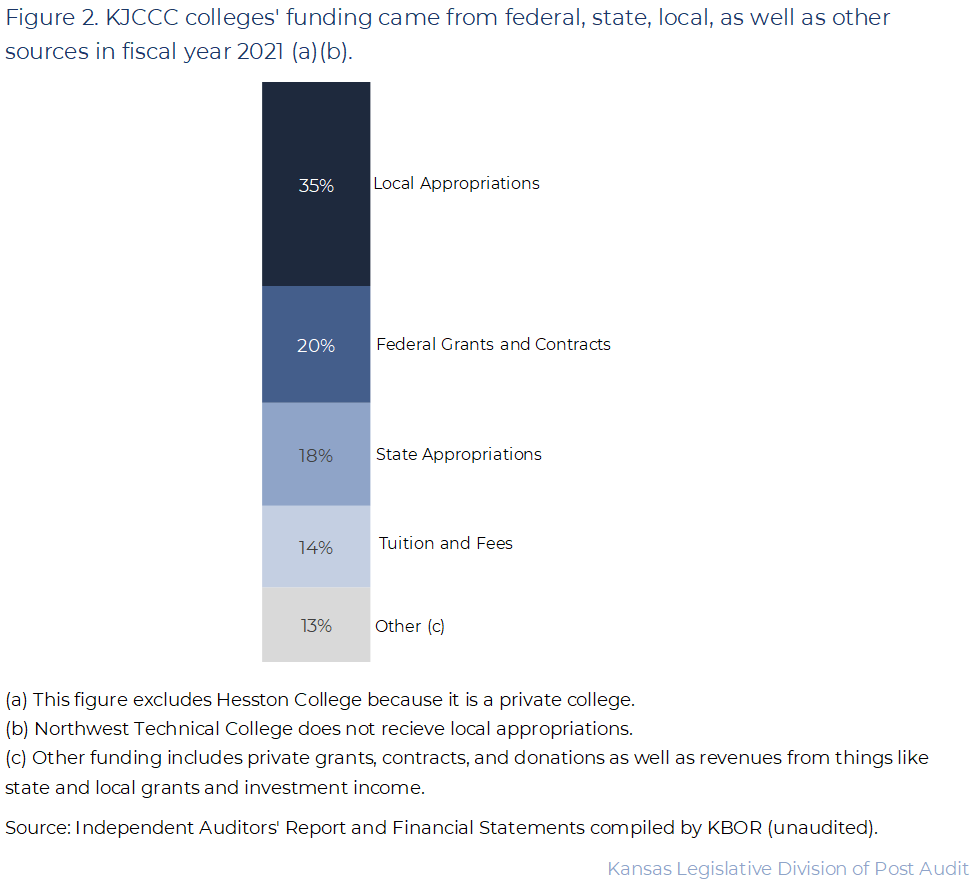
- Figure 2 shows the totals for all funding sources for the 20 public colleges in the KJCCC in fiscal year 2021. The colleges reported about $840 million in total revenue in that year. Local appropriations, which include local property taxes, were the largest source of colleges’ revenues as shown in the figure. Individual colleges’ revenues vary. For example, local appropriations accounted for 8% of Highland Community College’s total revenue and 53% of Kansas City Kansas Community College’s total revenue in fiscal year 2021. Hesston College is excluded from the figure because it is a private institution and does not publicly report its funding sources.
- Colleges use a portion of the funds they receive to pay for athletics. Athletic spending is divided into 2 main categories:
- Athletic department spending includes personnel expenditures like salaries, taxes, and benefits for coaching and administrative staff (e.g., athletic directors and athletic trainers). It also includes non-personnel expenditures like team travel expenses, insurance, equipment, medical services, and recruitment.
- Athletic scholarship spending can include the cost of tuition and fees, room and board, course-related books and supplies, and certain transportation costs.
- State law (K.S.A. 71-203) prohibits colleges from using federal, state, or local funds on athletic scholarships. However, colleges can use those public funds on athletic departments. Scholarships must be paid with student fees, booster clubs, endowments, or other non-public sources of revenue.
We evaluated how much 3 community colleges spent on their athletic departments and scholarships from fiscal years 2018 to 2022.
- Part of our audit objective was to determine how much community colleges spent on athletic departments and scholarships. To do this, we reviewed expenditures from Butler, Garden City, and Hutchinson Community Colleges from fiscal years 2018 to 2022. We chose these colleges because they offered most of the major sports programs (i.e. football, volleyball, softball, baseball, and both men’s and women’s basketball and soccer) and had a large number of student athletes (e.g., all 3 colleges had between 215 and 424 total student athletes each year). This allowed us to gather and compare data for a large number of student athletes and a large amount of athletic scholarship spending across sports.
- Our results are not projectable to all KJCCC colleges for 2 primary reasons.
- Community colleges vary widely across the KJCCC in the number of student athletes participating, the number and type of sports offered, and the divisions in which those sports compete. Butler Community College offers 11 sports, Hutchinson Community College offers 14, and Garden City Community College offers 17. Colleges may compete in different divisions for different sports. For example, one college may compete in division I for basketball while competing in division II for soccer. All KJCCC colleges competed in division I or II sports.
- Community college officials told us they largely have discretion to budget and administer programs within guidelines set by the Kansas Department of Administration and state and federal law. However, colleges may categorize funds and expenditures differently from 1 college to another within the requirements of state law. For instance, some colleges may categorize recruitment travel expenses as athletic department expenditures. However, other colleges may categorize recruitment-related travel and other transportation expenses as general travel.
- We did not evaluate all colleges in the KJCCC due to lack of readily available data and time constraints. However, we reviewed publicly available conference-wide data to provide broader context when possible.
Athletic Department Spending
From fiscal years 2018 to 2022 each of the 3 colleges spent an average of $2.5 to $3.3 million annually on their athletic departments.
- Figure 3 illustrates how athletic department expenditures changed over time and how they compare to each college’s total expenditures. As the figure shows, all 3 colleges’ athletic department expenditures generally increased from fiscal year 2018 to fiscal year 2022.
- As the figure also shows, Garden City Community College spent a larger percentage of its total expenditures on its athletics department than either Butler or Hutchinson Community Colleges. This is because the athletic department at Garden City Community College offers more sports and has more student athletes than the other 2 colleges despite being a smaller college with a smaller student body and less total expenditures.
- Community college officials told us that the return to normal spending after COVID-19 as well as inflation caused increased spending over time. COVID-19 affected the length of the seasons, number of contests played, as well as travel restrictions for athletes. This reduced participation and spending. Further, community college officials told us that insurance and employee benefits generally increase costs each year.
Most of the 3 colleges’ athletic department spending was for coaching salaries, and the sports of football and basketball.
- We evaluated fiscal year 2022 athletic department expenditures by sport and expenditure category for Butler, Garden City, and Hutchinson Community Colleges. The exact amount colleges spend on each category and sport changes from year-to-year. However, the biggest cost drivers remain the same.
- Figure 4 shows each college’s athletic department spending by expenditure category and sport in fiscal year 2022. As the figure shows, each college spent around 60% of their athletic department spending on salaries and around 10% on insurance. By sport, each college spent the most (between 17% and 24%) on football.
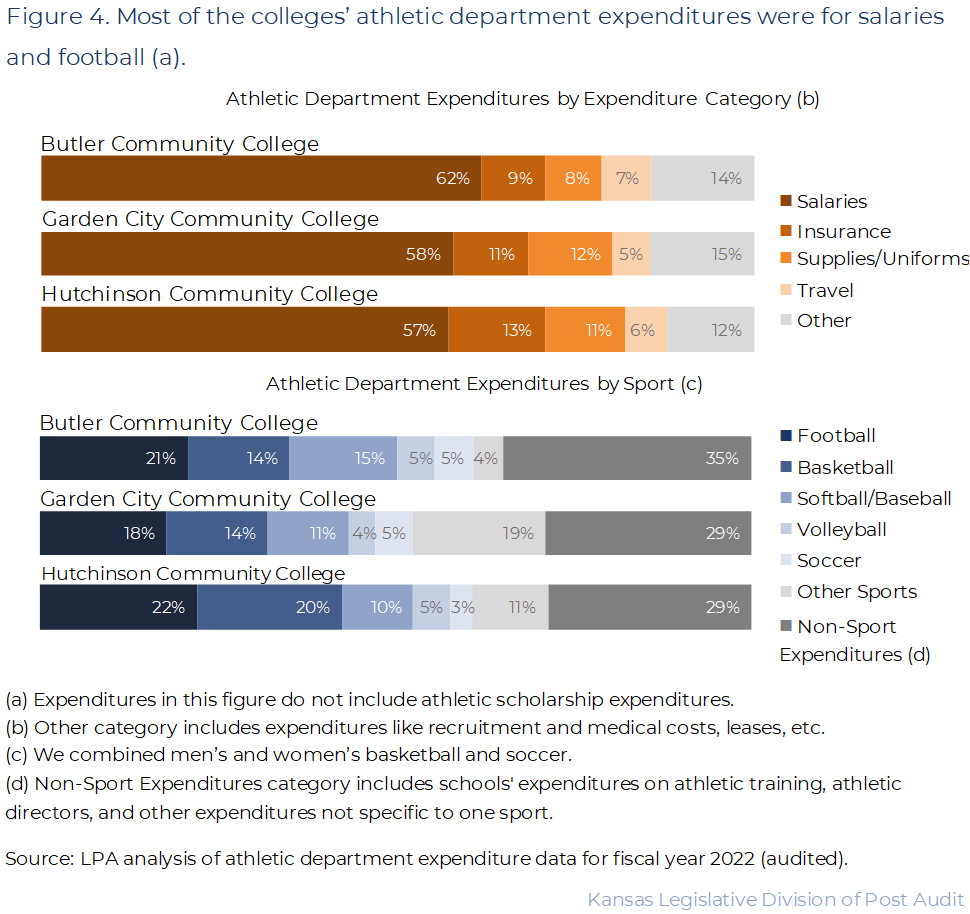
- Football tends to have larger teams and a larger coaching staff, which contributes to the high cost. For example, coaching salary expenditures for football were about 2 to 3 times more than the salary expenditures of the next highest sport.
We could not determine the exact funding sources colleges used to pay for athletic department expenditures because colleges’ operating funds are combined in a single account.
- Colleges receive funding from a variety of sources. This includes public funds from the federal and state government and local property tax revenue. It also includes funds from student tuition and may include private funds from booster clubs and donors.
- Part of our audit objective was to determine the funding sources colleges used to pay for athletic departments. However, the 3 colleges we reviewed couldn’t report the exact funding source of their athletic department expenditures. That’s because most community college funding is deposited in a single account that colleges use to pay for their operations, including their athletic departments. The community colleges told us this is because most funding sources aren’t restricted by state law. Therefore, neither the colleges nor we can say how much athletic department spending came from each funding source. We reviewed budget documentation and talked to officials about how they ensure compliance with state law.
- Community colleges told us they use different accounts to pay for athletic scholarships. They said that those accounts only include non-restricted dollars like private funds and student fees to ensure they comply with state legal requirements. At some community colleges, private funds are held by the foundation. We discuss funding for athletic scholarships spending later in the report.
Athletic Scholarship Spending
From fiscal years 2018 to 2022, the 3 colleges we reviewed spent an average of about $1.1 million to $1.4 million annually on athletic scholarships.
- For this part of the audit, we reviewed spending data for all athletic scholarships awarded from Butler, Garden City, and Hutchinson Community Colleges for fiscal years 2018 to 2022. We included all athletic scholarships student athletes received, but we did not include other scholarships student athletes may have received for academic achievement or service.
- Community college officials told us that when a college awards a scholarship to a student athlete, it pays for that cost by transferring funds from non-restricted funds. For example, a college may transfer funding from its auxiliary funds account to the college’s account for general operations to cover the cost of tuition for an athlete.
- Figure 5 illustrates how much the 3 colleges spent on athletic scholarships over the 5 years we reviewed. As the figure shows, all 3 colleges spent between about $1.1 million and $1.4 million on average per year on athletic scholarships.
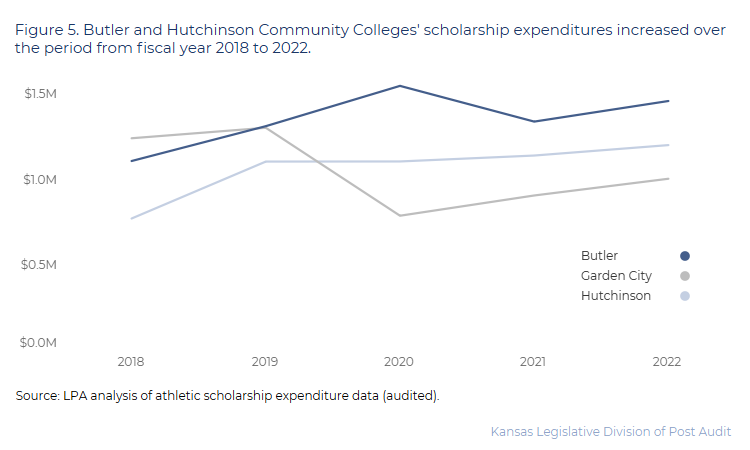
- Figure 5 also shows that all 3 community colleges’ spending on athletic scholarships generally increased each year, likely due to inflation. The exception is that athletic scholarship spending dropped or stagnated in either fiscal year 2020 or 2021 at each college. Community college officials told us this was due to the COVID-19 pandemic when fewer student athletes enrolled at the colleges and fewer scholarships were needed.
- Each of the 3 colleges we reviewed spent between 19% to 38% of their total athletic department and scholarship spending on athletic scholarships annually. Butler Community College spent the highest percentage on athletic scholarships (35% on average), and Hutchinson Community College spent the least (24% on average).
The 3 colleges we reviewed reported that student fees were the main funding source of athletic scholarships in the years we reviewed.
- The 3 community colleges we reviewed reported their funding sources for student athletic scholarships. We did a few high-level checks and talked with officials to ensure the information reported was logical.
- Butler and Garden City Community Colleges reported they used student fees to pay for all or almost all of their athletic scholarship spending each year. Butler Community College funded a small portion of scholarships using private funds like booster clubs and endowments.
- Hutchinson Community College also reported using student fees to pay for a large portion of its athletic scholarship spending each year (ranging from 48% to 85% annually). However, unlike Butler and Garden City Community Colleges, Hutchinson Community College also used auxiliary funds and other funding sources like tickets sales and concessions revenues to pay for athletic scholarships. College officials said they may change funding sources from year-to-year based on the needs of the college.
The 3 colleges’ total athletic spending (department spending plus scholarship spending) was similar to the other 18 KJCCC schools in fiscal year 2021.
- We used the Equity in Athletics Disclosure Act (EADA) data to compare athletic expenditures for all KJCCC colleges in fiscal year 2021. Schools self-report expenditure data to the EADA, including athletic department spending and athletic scholarship spending. The data is unaudited and includes slightly different expenditures than the data the 3 colleges reported to us. Additionally, the EADA data may include some private funds that may not be included in the college’s total expenditures. The differences are small enough that we think it’s appropriate to give a high-level, broad view of the conference as a whole.
- Combined, the 3 colleges we reviewed spent an average of $3.6 million to $4.4 million on both athletic departments and athletic scholarships during the 5 years we reviewed. This was equal to 8% to 13% of the colleges’ total spending.
- Figure 6 shows colleges’ combined athletic department and athletic scholarship spending compared to their total spending in fiscal year 2021. As the figure shows, the 21 colleges in the KJCCC reported spending 1% to 15% of their total spending on athletics. Butler, Garden City, and Hutchinson Community Colleges’ spending was generally in the middle of these amounts.
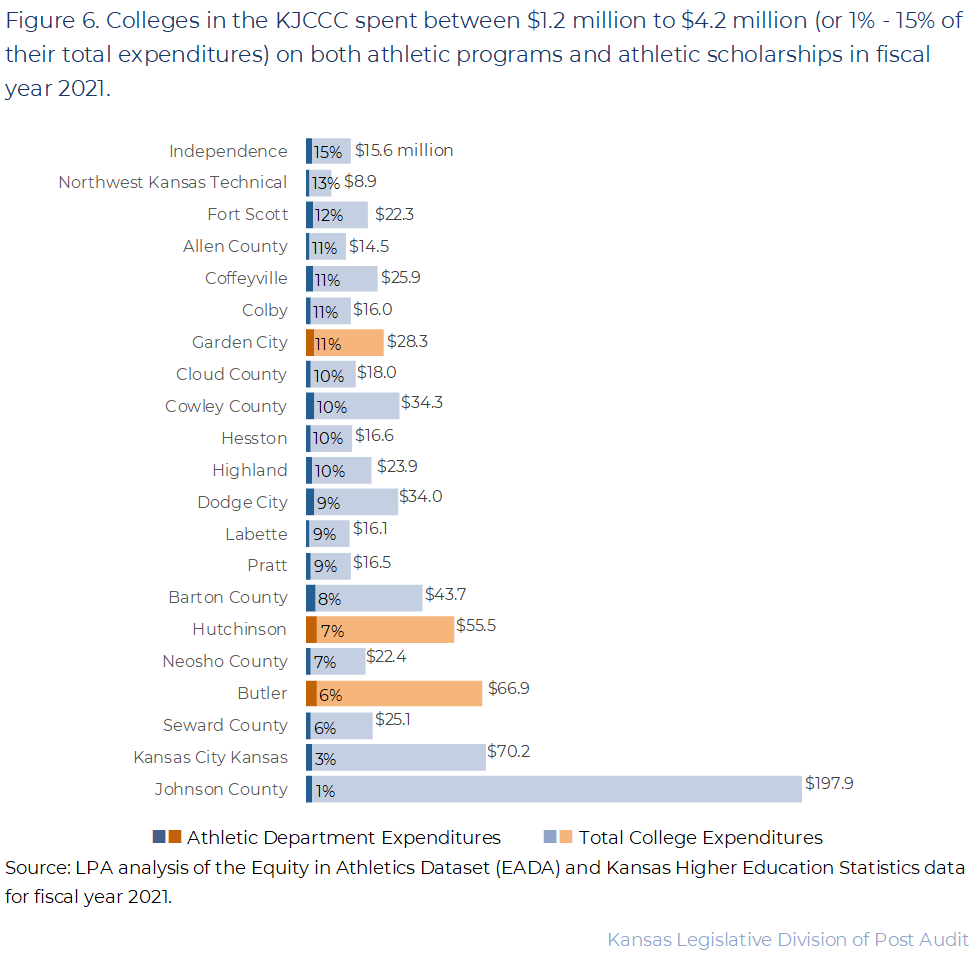
- The number of sports that colleges in the KJCCC participate in varies. Some participate in less than 10 sports whereas others participate in close to 20 sports. The colleges that reported spending the most on athletics typically had football programs. This is likely because football programs have the largest rosters and are the most expensive of the sports we reviewed.
For the 3 community colleges and 8 sports we reviewed from fiscal years 2018 to 2022, about 1/3 of student athletes and scholarship recipients were from Kansas, while about 2/3 of athletes and scholarship recipients were from other states or countries.
Most student athletes at the 3 colleges we reviewed were from other states and countries.
- For this part of the audit, we reviewed student-level data from Butler, Garden City, and Hutchinson Community Colleges for fiscal years 2018 to 2022. We also limited our review to all athletes on the certified rosters of 8 major sports programs: football, volleyball, softball, baseball, as well as both men’s and women’s basketball and soccer. Athletes on the certified rosters do not include red-shirt or transfer athletes who aren’t active participants in their respective sports. The data we reviewed included student athletes with and without scholarships.
- We limited our review to those 8 sports so that we could compare data across colleges based on as similar information as possible. This is different than the previous question where the data included spending for all sports that colleges offered.
- Even so, there were differences between the 3 colleges we reviewed. Garden City Community College competed in all 8 sports, whereas Butler and Hutchinson Community Colleges competed in 7 of the 8 sports. Neither college had a men’s soccer team. This makes Butler and Hutchinson Community College’s student athlete count lower than that of Garden City Community College. Further, Hutchinson Community College did not provide non-scholarship student athletes for fiscal year 2018, so the number of student athletes provided for that year is slightly lower than it should be. Our results are not projectable to all KJCCC colleges. Colleges vary widely across the KJCCC in the number of student athletes participating, and the number and type of sports offered. Colleges also largely have discretion to administer programs.
- For each of the 3 colleges, all sports included competed in division I, which allows the highest level of athletic scholarships.
- The student-level residency data we received from Butler and Hutchinson Community Colleges was based on students’ permanent addresses from when they applied to the college. However, the data from Garden City Community College was based on students’ most recent permanent addresses. This means the Garden City data may not accurately reflect where some students are from if their permanent address changed after they enrolled.
- 2,252 student athletes participated in the 8 sports we reviewed from fiscal years 2018 to 2022. About 31% of those student athletes were from Kansas, about 60% were from another state, and about 8% were from another country. This is very different than the colleges’ overall student bodies. For example, in fiscal year 2022, the 3 colleges reported about 17,500 of their 20,000 students (87%) were from Kansas.
- Figure 7 shows the number of student athletes who participated in the 8 sports we reviewed from fiscal years 2018 to 2022 and where they were from (Kansas, other states, and other countries). As the figure shows, the in-state, out-of-state, and international distribution of student athletes remained relatively stable across the 3 community colleges we reviewed during this 5-year period. The exception is fiscal year 2022 when Hutchinson Community College had a significant increase in Kansas student athletes and decrease in out-of-state student athletes.
- Garden City Community College generally had the highest percentage of out-of-state student athletes each year. Butler Community College generally had the lowest percentage of out-of-state student athletes each year. Community college officials told us that their proximity to state lines or rural location influences recruiting and may contribute to an increased number of out-of-state student athletes.
Nearly all student athletes received athletic scholarships, meaning the 3 colleges awarded most athletic scholarships to out-of-state students, too.
- Figure 8 shows the number of student athletes at Butler, Garden City, and Hutchinson Community Colleges during the 5-year period we reviewed, and which states they were from. As the bottom portion of the figure shows, most student athletes at all 3 colleges received athletic scholarships. This was true in all 5 years we reviewed.
- Because of this, the percentage of athletic scholarship dollars that colleges awarded to student athletes from Kansas and other states and countries was similar to the percentage of student athletes from those locations. For example, 31% of student athletes were from Kansas and 37% of athletic scholarship dollars went to Kansas athletes on average for the 3 schools we reviewed.
- However, colleges have discretion in determining the amount of athletic scholarships they award to each student athlete. For example, colleges can award full or partial scholarships within the guidelines of the NJCAA and KJCCC according to division. Community college officials told us they typically award about $3,000 – $4,000 in athletic scholarships per student athlete. They said this is generally much less than the allowable limit for athletic scholarships.
- This discretion led to some differences across schools. Figure 9 shows the percentage of each college’s athletic scholarship dollars that went to student athletes from other states and countries. As the figure shows, Butler and Garden City Community Colleges tended to spend most (50% or more) of their athletic scholarship dollars on out-of-state student athletes each year. This makes sense because it is generally in line with the percentage of out-of-state student athletes at both colleges.
- This is different than Hutchinson Community College, which tended to spend most (49% or more) of its athletic scholarship dollars on Kansas student athletes each year. Only 30% of student athletes at the college were from Kansas on average each year. This means that Hutchinson Community College gave more or higher-value scholarships to Kansas student athletes than out-of-state or international student athletes.
The percentages of student athletes from Kansas and other states and countries were similar for all 21 colleges in the KJCCC in fiscal year 2022.
- We analyzed publicly available roster data for all 21 colleges in the KJCCC in fiscal year 2022. Students usually report the hometowns listed on rosters, which may be different than their residency status for enrollment and financial aid. For instance, a student who moved to Kansas from a different country and graduated from a Kansas high school would be considered a Kansas student for enrollment purposes. But the student may have listed their international hometown in the roster. Therefore, this data is different than the data we analyzed from the 3 community colleges we reviewed, but the differences are small enough that we think it’s appropriate to give a high-level, broad view of the conference.
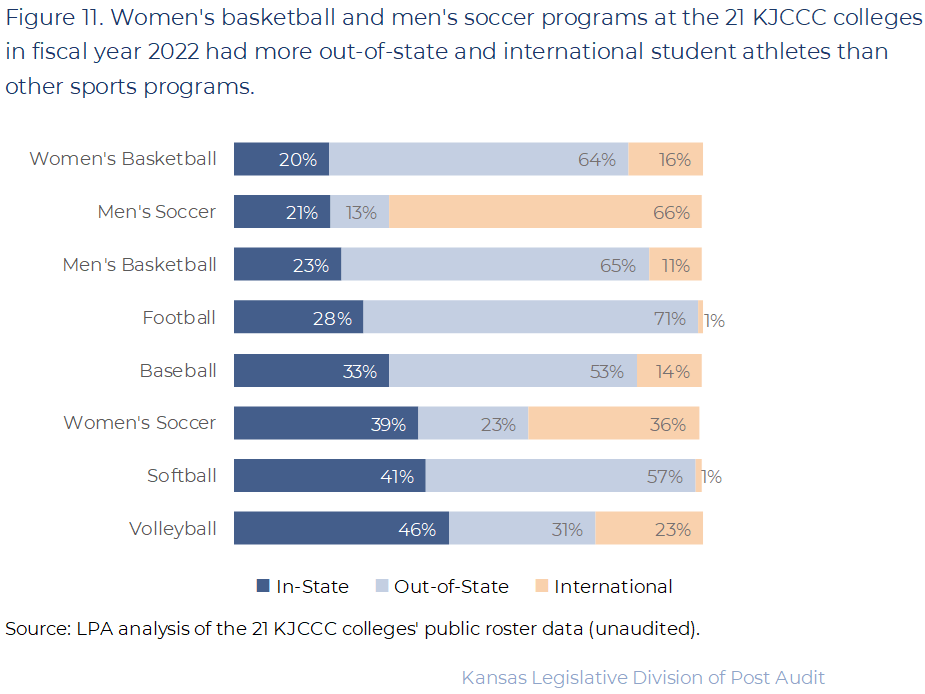
- During fiscal year 2022 there were about 3,200 student athletes competing in the 8 KJCCC sports we reviewed at all 21 KJCCC colleges. About 31% of those student athletes were from Kansas, about 50% were from another state, and about 18% were from another country. However, the in-state, out-of-state, and international proportions vary widely by sport and by college.
- Figure 10 shows which states student athletes were from across all 21 KJCCC colleges in fiscal year 2022. As the figure shows, most out-of-state student athletes were from Texas, Oklahoma, Missouri, Florida, and Georgia.
- Figure 11 illustrates where student athletes were from for each of the 8 sports we reviewed in fiscal year 2022. As the figure shows, the majority of student athletes in each sport we reviewed were from another state or country. For example, 54% to 80% of student athletes were from outside Kansas for all 8 sports. Football and men’s and women’s basketball had the largest percentages of out-of-state athletes. Men’s and women’s soccer had the largest percentages of international students.
Officials told us things like the size of the recruitment pool and location were factors in where student athletes came from.
- We talked to presidents, coaches, and athletic directors from 6 colleges in the KJCCC about recruiting. A recurring theme was that 1 of the biggest challenges in recruiting is the small pool of Kansas student athletes. There are many schools competing for the top recruits. After exhausting the local pool, coaches must look outside Kansas for the best available athletes to fill rosters. Community college officials also told us that sometimes recruits may not end up attending the college or playing, and teams must have players in key positions to be competitive.
- Many colleges in Kansas are close to the state border. Officials explained that after exhausting the local pool, the cost of recruiting an out-of-state student athlete may be lower than recruiting an in-state athlete because the neighboring state may be closer than other parts of Kansas, which reduces travel costs.
- 1 college official explained that states like Florida and Georgia don’t have junior college football. Thus, student athletes in those states must look to other states if they want to play junior college football. Kansas has 7 community colleges that offer football. This may be why more student athletes from these states choose to attend college in Kansas.
- College officials told us that soccer is not a popular sport in Kansas high schools or even in the United States, so the pool of potential recruits is low. Additionally, they said certain areas of Kansas have very few soccer teams, which further limits the pool of available recruits and often results in an increased need for out-of-state or international recruiting. Often coaches must look outside Kansas or the country to fill out their rosters with the best athletes.
Conclusion
Kansas has 21 KJCC colleges which are independent entities governed by boards of trustees. Colleges can choose to offer athletic programs for a variety of reasons. This includes providing students opportunities to continue their education and playing careers. Athletic programs also bring money and attention to colleges, which likely allow them to be more competitive in other aspects too; e.g., facilities, student programs, and funding personnel costs. The vast majority of the student bodies at these 21 colleges are from Kansas. However, most student athletes in the 8 sports and 3 community colleges we reviewed are not from Kansas. Correspondingly, most athletic scholarships at those 3 colleges also go to student athletes who aren’t from Kansas.
That makes sense because Kansas has 21 KJCC colleges and multiple other universities with athletics but only a limited number of potential student athletes. Additionally, some other states do not have certain community college sports programs, which means those athletes must go outside their state to pursue an athletic career. At least some of those student athletes choose Kansas.
Recommendations
We did not make any recommendations for this audit.
Agency Response
On January 5th, 2024, we provided the draft audit report to Butler Community College, Garden City Community College, Hutchinson Community College, and the Kansas Association of Community Colleges. We made several corrections and changes based on their feedback, but these did not affect our overall conclusions. They also provided a joint written response below. In their response, they disagreed with some of our methodologies. We reviewed their concerns but chose not to make additional changes for the reasons described below.
- The organizations contend that our focus on 8 sports is misleading. We do not think this approach is misleading because we clearly explain in the report which information includes all sports (question 1) and which information is limited to the 8 sports (question 2). We chose to limit the information on the number of student athletes and athletic scholarships to 8 sports to make the comparisons across colleges as similar as possible. All 3 colleges in our sample had most of the 8 sports we focused on, and all of those sports were division I. This helped minimize the various differences the organizations describe in their response.
- The organizations contend the Equity in Athletic Disclosure Act (EADA) data shouldn’t be used to estimate the percentage each college spends on athletics. We acknowledge the EADA data are imperfect and can’t be used to determine exact spending. However, we think they’re appropriate to use to provide general context. For example, even though different data sources may include or exclude different expenditures (like private funds), we do not think those differences would be large enough to prevent general comparisons.
- The organizations contend that publicly available rosters aren’t reliable to estimate the number of student athletes or their residency. We acknowledge that publicly available rosters are imperfect. However, we compared roster data to the detailed student-level data Butler, Garden City, and Hutchinson Community Colleges provided to us and concluded those schools’ rosters provided reasonable estimates. We make it clear in the report that the roster data has limitations, but we think it can be used for estimates.
Kansas Association of Community Colleges, Butler Community College, Garden City Community College, and Hutchinson Community College Response
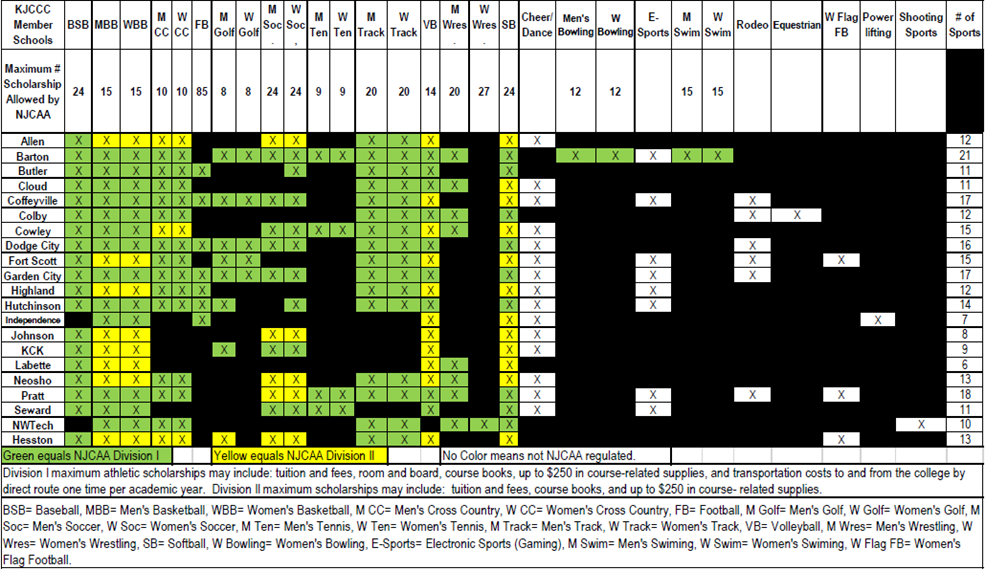
Thank you for the opportunity to comment on this audit. The KJCCC member colleges involved commend the Legislative Post Audit staff on their work in conducting this audit and on the amount of effort put into trying to learn about this very complicated topic. While historically, the Kansas Jayhawk Community College Conference (KJCCC) members were only community colleges, over the years one Kansas technical college and one Kansas independent college have been added to the conference. Throughout the report, statements may reference community colleges, which should say KJCCC member colleges to be inclusive of all conference members. The 21 KJCCC conference members include: Allen Community College, Barton Community College, Butler Community College, Coffeyville Community College, Cloud Community College, Colby Community College, Cowley Community College, Dodge City Community College, Fort Scott Community College, Garden City Community College, Highland Community College, Hutchinson Community College, Independence Community College, Johnson County Community College, Kansas City Kansas Community College, Labette Community College, Neosho Community College, Pratt Community College, Seward Community College, Northwest Technical College, and Hesston College.
Throughout the audit, the KJCCC member colleges encouraged LPA to look at all sports at these institutions. However, LPA chose to make value judgments about the “major” sports and narrowed the focus of some sections of this report to the eight “major” sports that LPA chose. The KJCCC believes all sports are “major” and disagrees with this methodology. Additionally, because some sections of this report focus only on the LPA-chosen eight “major” sports and other sections of this report cover expenditures from all sports at KJCCC member colleges, there are various places that the report is confusing to the reader, and incorrect conclusions may be drawn. Additionally, because each sport has different roster size limits and scholarship limits, and each KJCCC member college offers a different number of sports, while the report compares colleges, there is nothing remotely similar from one college to the next. The three colleges (Butler, Hutchinson, and Garden City) that were studied in more depth do not even all have the LPA chosen eight “major” sports. Butler and Hutchinson do not offer men’s soccer and have only seven of the eight “major” sports. These differences make comparing colleges in the charts in the report misleading. For context, below, a chart has been provided that lists all of the sports offered by KJCCC member colleges, along with the roster size limits (if NJCAA sanctioned) as well as designation that the college offers the sport at the Division I or Division II level. The divisional scholarship limit differences are another reason that comparing one college to another is not equivalent in this report.
This subject matter is complex and changes year to year based upon the National Junior College Athletic Association (NJCAA) rules, KJCCC conference rules, and whether a college offers the sport and if they are choosing to compete at the Division I or Division II level. There are various areas of the LPA report in which we asked for additional detail to be included to provide this context to the reader to ensure better understanding of the subject matter. While some clarifications were added, many of these requests and suggestions were not included in the final report, leaving the reader potentially making assumptions that need to be corrected. To better clarify areas of the report which are unclear or require additional essential information, the following is provided for context and understanding.
While the NJCAA provides Division I and Division II athletic scholarship limits, most Kansas community colleges offer far less than the maximum allowable scholarships. The LPA report states that the average Division I scholarship provided averages between $3,000 and $4,000. To provide context a full Division I scholarship (tuition, fees, books, $250 supplies, room, board, and one trip to campus) would be valued on average at about $7,500 to $8,000. To provide a full Division II scholarship (tuition, fees, and books) would be valued on average at about $2,700. Most students’ athletic scholarships do not cover even half of the full cost of attendance. Additionally, some colleges offer athletic scholarships as last-dollar scholarships to cover any expenses allowable that aren’t covered by a student’s federal Pell Grant or other scholarships.
While the LPA report states that football is the most expensive sport, this statement needs more context. Football requires about four times as many athletes to play than other sports. The NJCAA scholarship limit for football is 85. The next highest scholarship limit in which most colleges participate is 24 for men’s and women’s soccer and softball. Larger teams require more coaches, and reflect additional meal, transportation, lodging, and equipment costs for example, merely due to the number of athletes participating.
KJCCC colleges informed LPA that the Equity in Athletics Disclosure Act (EADA) report, which is referenced in this audit, is being used in a way that is not its intended purpose. The information in the EADA report includes private gifts, sponsorship revenue, and corporate sponsorship revenue, which in many cases may not actually be in the college’s operational athletic department budget but managed by a booster club, foundation, or athletic support association. Therefore, comparing the EADA “amount spent” for athletics to the college’s budget may provide perspective, but provides a potentially inaccurate picture by stating that this spending is a certain percentage of the college budget. These percentages may not be accurate as these outside funds are unlikely to be in the college’s operational budget.
KJCCC member colleges are not mandated to publish complete rosters on their website and in fact many colleges do not have adequate staff to keep rosters up to date. Additionally, student athletes can choose from what hometown and state they want to be listed on the roster. The LPA used this data for Figure 10. This data is incomplete at best and cannot be taken as 100% accurate in terms of where student athletes are actually from or how many athletes actually participated on the team. Athletes can compete in multiple sports and especially track and cross country the rosters are often unreliable as the same athlete may be listed on rosters for cross country, indoor track, and outdoor track.
KJCCC member colleges follow state law and do not use public funds for athletic scholarships as required by Kansas statute. The funding of KJCCC member colleges’ athletic departments is approved by each college’s governing board and in accordance with all applicable laws, regulations, and college policies.
Finally, while the LPA contacted and had multiple correspondences with the NJCAA as part of this audit, those contacts did not make it into the final report. For context, it is important for legislators to know that the NJCAA was contacted for information. KJCCC colleges take compliance with all state and federal laws, as well as NJCAA regulations, very seriously. Throughout this audit process, KJCCC colleges reiterated that they follow NJCAA guidelines continuously. Also omitted from this audit is the fact that the NJCAA audits member institutions to ensure compliance with scholarship guidelines. The KJCCC conference is the premiere NJCAA conference in the country with many recognized elite athletes. Our colleges recruit the best Kansas athletes first but often compete with the Kansas Board of Regent’s institutions, Washburn, and Kansas Collegiate Athletic Conference (KCAC) and Mid-America Intercollegiate Athletics Association (MIAA) colleges for top recruits’ athletic talent. To compete at the highest level, KJCCC colleges find the top talent available, hopefully from Kansas, but then fill rosters with the next best athletes available to compete for national titles. KJCCC member colleges won the following national championships between 2017 and 2021: Football (Hutchinson), Men’s Basketball (Coffeyville and Hutchinson), Volleyball (Johnson County and Coffeyville), Men’s Cross Country (Colby, Cowley, and Cloud), Women’s Cross Country (Cowley Twice), Men’s Track (Cloud and Barton), Men’s Golf (Hutchinson Twice), Men’s Tennis (Seward), E-Sports (Barton-Four games, Highland, Hutchinson- Three games), and Cheerleading (Dodge City) plus many more runner-ups finishes and other outstanding performances. These sporting events bring thousands of people from across the state and country to experience Kansas and spend their resources taking in athletic events, shopping, eating, and staying in local hotels. Kansas hosts many NJCAA national championship events, bringing in millions of dollars to the Kansas economy and exposing people from other states and countries to our great state. Each year, the NJCAA recognizes teams across the nation as top academic teams with team GPAs of 3.0 to 4.0. The NJCAA also recognizes individual athletes across the nation as NJCAA Academic First Team, Second Team and Third Team All Americans. In FY22 alone, the KJCCC had 152 teams who were recognized with team GPAs between 3. 0 and 4.0 as well as individual athletes earning 431 NJCAA Academic First Team All American recognition with GPAs of 4.0.
Thank you for the opportunity to provide this additional context to the report.
Appendix A – Cited References
This appendix lists the major publications we relied on for this report.
- Equity in Athletics Data (2018-2022). U.S. Department of Education.
- Kansas Higher Education Statistics (January, 2023). Kansas Board of Regents.
- NJCAA Handbook (February, 2023). National Junior College Athletic Association.
- KJCCC Handbook (August, 2022). Kansas Jayhawk Community College Conference.