Reviewing the KPERS 3 Retirement Plan
Introduction
Representative Nick Hoheisel requested this audit, which was authorized by the Legislative Post Audit Committee at its April 25, 2023 meeting.
Objectives, Scope, & Methodology
Our audit objective was to answer the following question:
- How does the KPERS 3 plan compare to other retirement plan options on key metrics?
To answer this question, we worked with Kansas Public Employee Retirement System (KPERS) officials to understand the state’s KPERS 3 retirement plan. We compared the KPERS 3 plan to defined benefit, defined contribution, cash balance, and hybrid plans from other states and to plans from recently proposed legislation in Kansas. We evaluated and compared these retirement plans using several metrics to understand how the plans operate and how they differ. We also used an employee simulation model to estimate the real value and cost of benefits offered by the plans in a few different scenarios. Last, we reviewed literature, conducted a survey of KPERS-covered employees, and interviewed officials from KPERS-covered organizations to assess the impacts the KPERS 3 plan may have on employee hiring and retention. More specific details about the scope of our work and the methods we used are included throughout the report as appropriate.
Important Disclosures
We conducted this performance audit in accordance with generally accepted government auditing standards. Those standards require that we plan and perform the audit to obtain sufficient, appropriate evidence to provide a reasonable basis for our findings and conclusions based on our audit objectives. Overall, we believe the evidence obtained provides a reasonable basis for our findings and conclusions based on those audit objectives.
Generally accepted government auditing standards require that auditors and audit organizations maintain independence so that their opinions, findings, conclusions, judgments, and recommendations will be impartial and viewed as impartial by reasonable and informed third parties. The Legislative Division of Post Audit is a KPERS-covered employer. Any future changes to the KPERS system made by the legislature could impact the benefits our staff receive. However, we do not think this affected our analysis or the impartiality of our findings and conclusions. Further, we did not make any recommendations.
KPERS 3 gives employees less flexibility, requires them to share some financial risk, and generally provides lower benefits than other plans we evaluated.
Background
There are 4 broad plan types that describe the way in which most public retirement plans function.
- Public retirement plans are a form of retirement savings and security plan that state or government entities offer their employees. Upon retirement, employees covered under such a plan receive benefits that serve as retirement income. Benefits are usually distributed in the form of regular payments, often monthly. These plans are usually funded in part by the state through employer contributions, and in part by the employees themselves whose contributions are deducted from their paychecks.
- The majority of public retirement plans fall into 4 broad plan types. These broad types determine the overarching structure and function of a plan:
- Defined Benefit (DB) plans give members a guaranteed lifetime benefit upon retirement, usually paid monthly. Under this plan, all employee and employer contributions are pooled together into a single fund and invested by the state on behalf of all members. Individual members’ benefits are based on things like years of service and salary. Investment performance does not impact their benefits at all.
- Defined Contribution (DC) plans give members a benefit based on the total balance of their individual retirement account. This account holds employee and employer contributions and investment earnings. The final retirement benefit paid to the employee does not come in the form of regular payments and is not guaranteed for life. Rather, the benefit is finite and consists of the entire account balance, which depends heavily on investment performance. Generally, members have discretion over how their account is invested and can withdraw resources more easily.
- Cash Balance (CB) plans blend the functionality of defined benefit and defined contribution plans. Similar to a defined benefit plan, benefits are guaranteed for life. Member resources are also pooled together and professionally managed. However, as with a defined contribution plan, members still have an individual account, but it’s only partly affected by investment performance. This account is also notional: it doesn’t exist as a standalone account, nor is it separate from the rest of the pooled resources. It exists on paper and its balance is tracked through the system. The final retirement benefit calculation then depends on the final balance of a member’s notional account, which is the accumulation of contributions and interest.
- DB-DC Hybrid plans give members benefits from separate defined benefit and defined contribution components, which operate independently. Essentially, members are enrolled simultaneously in a defined benefit plan and a defined contribution plan. Members then receive a separate benefit from each of these two components. They receive a guaranteed lifetime benefit from their DB plan, and they receive the final balance of their account from their DC plan.
- Within these broad structures, public retirement plans can vary further based on a variety of factors. These factors may include retirement age limits, contribution amounts, and various distribution options. Two plans of the same type may not be exactly the same, and plans of different types may still share some similarities.
In Kansas, most public employees are eligible for retirement benefits through 1 of 3 tiers of the Kansas Public Employees Retirement System (KPERS).
- Kansas public employees eligible for KPERS include state, city, county, and school district employees, among others. A smaller number of Kansas police, firefighters, and judges belong to separate state retirement plans. Those plans are not part of this audit because they function differently and cover a much smaller group of employees. Therefore, when we refer to the KPERS plan in this audit, we’re referring to the 3 KPERS tiers that cover the vast majority of public employees in Kansas.
- The KPERS plan’s tiers are KPERS 1, KPERS 2, and KPERS 3. These tiers use different benefit calculations and cover different groups of employees based on their first date of employment.
- KPERS 1 is a defined benefit plan. It guarantees a lifetime benefit based on a formula. The Legislature created the original KPERS 1 tier in 1961, but it has undergone some changes since then. 1961 was also the same year the retirement system was established. KPERS 1 covers employees who were hired between January 1, 1962 and June 30, 2009.
- KPERS 2 is also a defined benefit plan that guarantees a lifetime benefit based on a formula. However, its formula uses a slightly different salary calculation than the KPERS 1 formula. The Legislature created the KPERS 2 tier in 2007. This tier covers employees who were hired between July 1, 2009 and December 31, 2014.
- KPERS 3 is a cash balance plan. Benefits are guaranteed for life, but they depend on a member’s notional account balance. The Legislature created the KPERS 3 tier in 2012. It covers employees who were hired on or after January 1, 2015. The only exceptions to this are state correctional officers, who continue to be enrolled in KPERS 2.
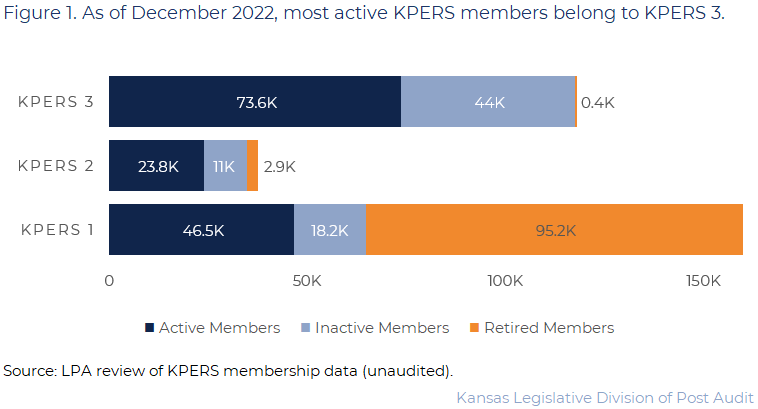
- Figure 1 summarizes the size of each of the 3 tiers as of December 2022. As the figure shows, KPERS 3 had the most active members (about 74,000). That’s about half of all KPERS-covered employees in Kansas. KPERS 3 also had the most inactive members (about 44,000). Inactive members are those who are no longer working in a KPERS-covered position but have also neither retired nor withdrawn. As the figure also shows, KPERS 1 had the most retired members. This makes sense given these members’ age and time of employment.
Kansas public employees and employers make contributions to the KPERS trust fund.
- KPERS administers Kansas’s public retirement plans. The agency’s primary purpose is to provide benefits to retirees and their beneficiaries and to acquire sufficient financial resources to provide those benefits. The financial resources for all 3 KPERS plan tiers are pooled together in the KPERS trust fund.
- Revenue for the trust fund comes from 3 sources: employee contributions, employer contributions, and investment returns. Employee contributions are deducted from each KPERS member’s paycheck and deposited into the fund. The employee contribution rate is set statutorily. Employer contributions are also deposited each pay period and are based on a percentage of the employer’s payroll. The employer contribution rate is determined actuarially by KPERS each year. Lastly, the fund’s investment gains and losses also affect the total fund balance.
- In 2022, the employee contribution rate was 6% of salary for all 3 KPERS tiers. The 2022 actuarial valuation set the employer contribution rate at 11.56% of payroll for state and school employers and 9.6% for city and county employers.
- KPERS reported that, from 2002 to 2022, 49% of all revenue to the KPERS trust fund came from investment returns. During this time, 35% came from employer contributions, and 16% came from employee contributions.
- The KPERS Board of Trustees is responsible for managing the trust fund. To fulfill this purpose, KPERS employs several investment professionals who manage the fund’s resources and provide oversight of external investment managers. The resources in the fund are invested across a diverse portfolio of asset classes, including domestic equity, real estate, and more. KPERS uses an investment return assumption of 7% as part of its benefit calculations.
- The assets in the trust fund are used to pay out retirement benefits to retirees across all 3 KPERS tiers. These assets are also used to pay out supplementary benefits, such as retiree death benefits. In order to continue paying all benefits, the fund must have enough in assets to cover them.
KPERS 3 History
Following the 2008 recession, investment losses weakened the financial health of the KPERS trust fund.
- The financial health of a pooled retirement fund such as KPERS can be determined by various factors:
- Actuarial liability is the total amount of actuarial assets that should be available in the trust fund to meet the funding plan and pay all benefits to current and future retirees. “Actuarial” refers to the mathematical calculations made by an actuary.
- Funded ratio is the percentage of the actuarial liability that the fund’s assets currently cover.
- Unfunded actuarial liability is the difference between the actuarial liability and the value of the fund’s current assets.
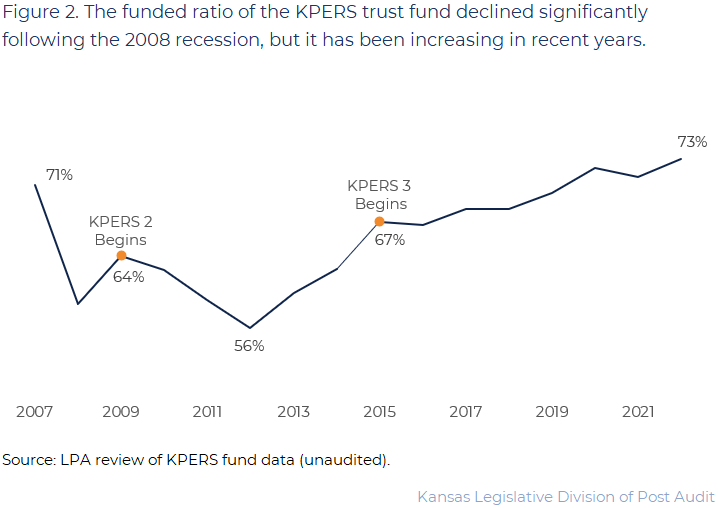
- In 2007, the funded ratio of the KPERS trust fund was about 71%. At that time, the trust fund was targeted to reach a 100% funded ratio by 2033, meaning that it would have the funds required to completely pay the actuarial liability. The Legislature also created the KPERS 2 tier in 2007, but it had not yet gone into effect.
- Figure 2 shows how the KPERS funded ratio has changed over time. In the wake of the 2008 recession, the funded ratio declined for 4 straight years as a result of investment losses. It eventually reached its lowest funded ratio of about 56% in 2012. After 2011, the trust fund was no longer projected to reach its full funding target by 2033. Along with the declining funded ratio, this prompted concerns over the long-term sustainability of the KPERS trust fund.
The Legislature created the KPERS 3 tier to help improve the long-term sustainability of the trust fund.
- In response to the 2008 recession and the declining trust fund, the Legislature sought a solution that would help decrease the unfunded actuarial liability by decreasing future costs to the state. The KPERS Study Commission was formed in 2011 to consider alternative retirement plan designs. The commission was tasked with developing a plan that would ensure the KPERS trust fund could continue to pay out all promised benefits in the long term.
- The Legislature enacted KPERS 3, which went into effect in 2015. The plan was intended to reduce the state’s retirement costs in order to help replenish the retirement fund. However, a reduction in costs is generally accompanied by a similar reduction in benefits. As such, KPERS 3 offered lower benefits compared to the other two tiers. Differences between benefit levels are estimated later in this report.
- Designed as a cash balance plan, KPERS 3 members make contributions to their notional accounts based on a percentage of their salary. The state makes contributions to the trust fund on behalf of employees. It provides funding to their accounts through “retirement credits”. Retirement credits are also made as a percentage of a member’s salary, and the percentage increases the longer the member works in a KPERS-covered position.
- Members are guaranteed 4% annual earnings on their account balances, but they can earn more depending on investment performance. Additional earnings above 4% are made through “dividends”. This only occurs if the 5-years average return exceeds 6%. In years when it does, members receive a dividend equal to 75% of the return above 6%. For example, if the average 5-year return were 10%, members would receive a one-time dividend equal to 3% (75% of 4%) of their account balance.
From 2015 to 2022, the funded ratio of the trust fund increased by 6 percentage points, but it’s unclear how much of that is due to KPERS 3.
- In general, public retirement plans target a funded ratio of 100% to ensure that future benefit payments can continue to be made in the long term. Funded ratios below 80% are generally considered to need improvement. The lower the funded ratio, the higher the risk that future benefits may not be covered by the fund’s assets.
- As shown in Figure 2, from 2015 to 2022, the funded ratio of the KPERS trust fund increased from about 67% to 73%. This was because the fund’s assets increased at a greater rate than its liabilities during this period. As of December 2022, the KPERS trust fund had about $26.4 billion in actuarial assets and $36 billion in liabilities. KPERS has reported that they are on track to eliminate the unfunded liability completely and reach a 100% funded ratio by 2039.
- It is unclear how much of the fund’s improvement since 2015 was due to KPERS 3. The funded ratio was already increasing in the 3 years prior to the implementation of KPERS 3. This may be because other factors besides plan design could have caused an increase in the funding ratio, such as higher investment returns or increased employer contributions. However, the creation of KPERS 3 likely contributed to the improvement due to the way in which KPERS 3 works. Whereas KPERS 1 and 2 benefits remain constant, KPERS 3 benefits partially decrease with lower investment returns. This reduces future liabilities and thus helps improve the funded ratio.
Plan Comparisons
Financial risk and employee flexibility are two key components of any retirement plan.
- Financial risk refers to the uncertainty of future retirement benefits experienced by both employees and employers. Employers are the state and local entities that employ members of the retirement plan and make contributions through state funding. When we refer to employers in this report, we’re referring to these entities or the state broadly. Financial risk affects employees and employers differently. For example:
- Employers take on most of the risk under defined benefit plans. That’s because they are obligated to pay employees a guaranteed retirement benefit as long as they live. In this case, employers take on the financial risk of poor market performance. Unfavorable investment returns mean the fund might not have enough to pay all guaranteed benefits. If there is a deficit, the employer would have to make it up with increased contributions. On the other hand, above average returns would yield a surplus to help fund future liabilities. This may lead to a decrease in employer contributions.
- Employees take on most of the risk under defined contribution plans. That’s because there is no guaranteed lifetime payment for these plans. Employees are free to invest as they choose, but future benefits are contingent on investment performance. Employees receive lower final benefit amounts when investment returns are lower than expected. However, employees could also receive higher final benefits from above-average investment returns.
- Employee flexibility refers to the amount of discretion employees have over their retirement plans. Plans with high flexibility allow employees to decide how much to contribute and how best to invest their funds. They also allow employees to easily transfer or withdraw their benefits with few or no penalties. On the other hand, plans with low flexibility are largely governed by an employer and are more restrictive for the employee. Typically, there’s a tradeoff between financial risk and flexibility, and different retirement plans contain different levels of each.
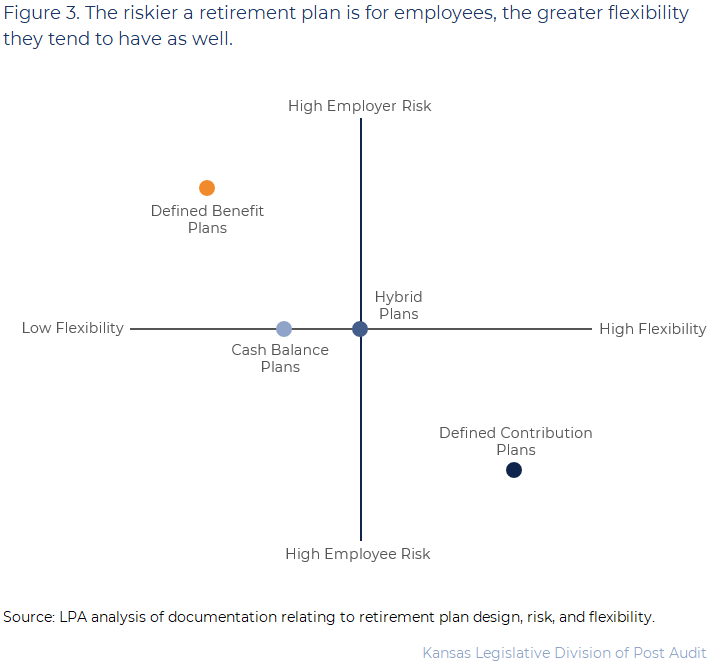
- Figure 3 demonstrates the relationship between financial risk and flexibility for the 4 broad retirement plan types. As the figure shows, the more risk an employer takes on, the less flexibility employees tend to have. With defined benefit plans, the employer bears almost all of the risk, and the employee has very little flexibility. On the other hand, the more risk employees take on, the more flexibility they tend to have. With defined contribution plans, employees bear almost all of the risk but also have a lot of flexibility. As the figure also shows, cash balance plans (such as KPERS 3) and hybrid plans balance these two variables to varying degrees. This is discussed in more detail in the next section.
Compared to other public retirement plans, KPERS 3 requires employees and employers to share financial risk while also giving employees less flexibility.
- We compared the financial risk and employee flexibility of KPERS 3 to 6 other public retirement plans. These included defined benefit (DB), defined contribution (DC), cash balance (CB), and DB-DC hybrid plans from Kansas, other states, and recently proposed Kansas legislation. To measure risk, we evaluated the way in which benefits are calculated for each plan and how investment performance impacts those benefits. To measure flexibility, we evaluated the portability and retirement requirements of each plan. The plans we compared to KPERS 3 were:
- KPERS 2. This is a defined benefit plan and a current KPERS tier. It was also the subject of a recent bill proposal that aimed to move KPERS 3 members to KPERS 2.
- Cash Balance Tier 2. This is a cash balance plan currently used by the state of Nebraska. We will refer to it as “Nebraska’s CB plan”.
- PERF. This is a DB-DC hybrid plan currently used by the state of Indiana, hereafter referred to as “Indiana’s hybrid plan”.
- Tier 2 Hybrid. This is a DB-DC hybrid plan currently used by the state of Utah, hereafter referred to as “Utah’s hybrid plan”.
- Thrift Savings Plan. This is a defined contribution plan that was the subject of a recent bill proposal in Kansas.
- Pathfinder. This is a defined contribution plan currently used by the state of Oklahoma, referred to as “Oklahoma’s DC plan”.
- After consulting with KPERS, we selected these 6 plans to provide a full cross-section of the 4 different plan types. We also selected plans from states with similar funding levels and numbers of public employees. To make our plan comparisons, we first spoke with KPERS staff to help us identify important retirement plan components. We then reviewed documentation and spoke with state officials to evaluate the risk and flexibility of each plan, along with many other components.
- Figure 4 compares the financial risk and employee flexibility of KPERS 3 to the 6 other plans we evaluated. As Figure 4 shows, KPERS 3 has shared employee and employer risk but lower employee flexibility compared to most other plans.
- The KPERS 3 plan requires employees and employers to share financial risk because both are impacted by investment returns. For employees, their final benefit amount varies based investment returns. They are guaranteed a minimum 4% annual return, but anything above that is dependent on investments. For the state, costs also vary depending on investment returns. KPERS 3 benefits are guaranteed for life, and so the state is obligated to meet its liabilities no matter what. If investments perform poorly, it must pay a minimum 4% return to employees. If investments perform well, it pays 75% of the returns above 6% to members. The rest can be credited to the trust fund and used to cover other liabilities.
- However, KPERS 3 employees have little flexibility over their plan. This is more similar to a defined benefit plan, like KPERS 2. For example, employee contribution rates are constant, and so employees have no control over how much they contribute. Further, the state’s Retirement System manages all of the trust fund’s resources, and so employees have no control over investments either. Employees also have little access to their funds prior to retirement. If they withdraw early, they forfeit the employer-provided portion of their account balance.
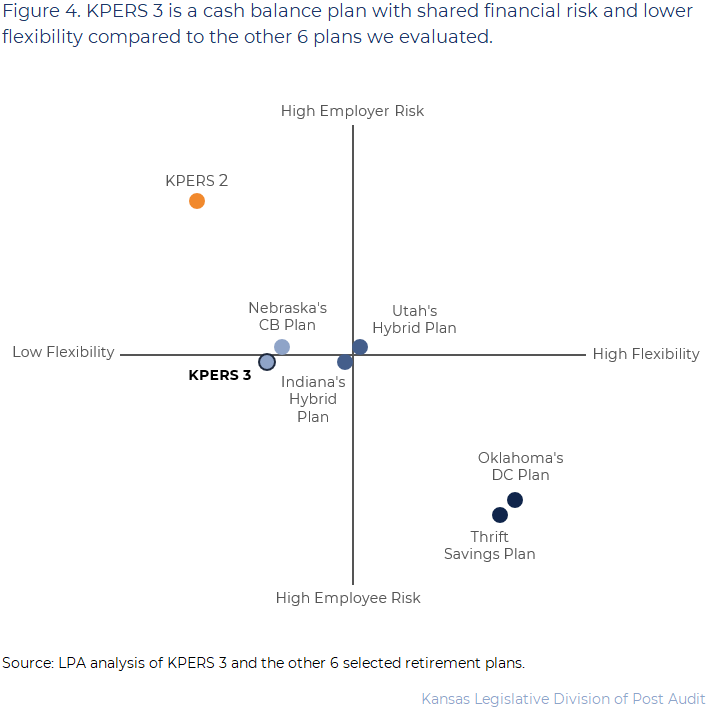
- KPERS 3 was most similar to the other cash balance and hybrid plans we reviewed. As Figure 4 shows, Nebraska’s CB plan is similar to KPERS 3 in terms of financial risk and flexibility. For example, Nebraska’s CB plan also requires employees and employers to share financial risk, and employees have little to no control over their account. Indiana and Utah’s hybrid plans had similar levels of risk compared to KPERS 3, but they also had slightly higher flexibility. With hybrid plans, employees have both a defined benefit and defined contribution plan that are maintained separately. As a result, employees end up with a mixture of the risk and flexibility offered by defined benefit and defined contribution plans. This means that these plans have a similar amount of risk-sharing compared to KPERS 3, but they offer more flexibility because employees have full control over their defined contribution plan.
KPERS 3 has higher employee contribution rates, a longer vesting period, and longer retirement requirements than most other plans we looked at.
- In addition to risk and flexibility, there are other retirement plan components that don’t significantly impact the risk or flexibility of a plan. These components operate somewhat independently of one another and can be modified without changing the overall plan type. However, these components are still very important to employees and employers. They describe in more detail how the plan works and what the benefits and costs of the plan are. The components that have the biggest impact on employees and employers are: employee contribution rates, retirement requirements, vesting periods, and cost of living adjustments (COLAs). Employer contributions and costs are also important; these costs are estimated more directly later in this report.
- The employee contribution rate is the amount that employees are required to contribute to their retirement plan. This is usually calculated as a percentage of salary, deducted from the employee’s paychecks. KPERS 3’s rate of 6% is higher than most of the plans we evaluated. It matches the KPERS 2 and Thrift Savings employee contribution rates. It is higher than the Nebraska CB plan’s contribution rate of 4.8%, and it is higher than the minimum requirements of the other defined contribution and hybrid plans.
- The retirement requirements are the age and years of service requirements that employees must meet before they’re eligible for unreduced benefits (i.e., normal retirement). KPERS 3 allows employees to retire and receive unreduced benefits if they are age 65 with at least 5 years of service or age 60 with at least 30 years. These are the highest age and service requirements of the 7 plans we looked at. Nebraska’s CB plan allows for retirement at age 55, regardless of years of service. Utah’s hybrid plan and Indiana’s hybrid plan have lower years of service requirements, and they allow employees to retire at age 55 or earlier with at least 35 years of service.
- The vesting period of a retirement plan is the length of time employees must work under the plan to be guaranteed a benefit upon retirement. If employees leave before the vesting period is complete, they cannot receive a retirement benefit and may forfeit employer contributions. KPERS 3’s vesting period is 5 years, which is shorter than the 10-year vesting period of Indiana’s hybrid plan. It is longer than the vesting periods of Nebraska’s CB plan (3 years), Utah’s hybrid plan (4 years), Thrift Savings (immediate for employee contributions; 5 years for employer contributions), and Oklahoma’s DC plan (immediate for employee contributions; progressively vested over 5 years for employer contributions).
- A COLA for a retirement plan is a cost of living adjustment that gradually increases the amount of benefits received over time in retirement. This is done to account for potential economic factors like inflation. KPERS 3 was 1 of 3 plans we looked at that had an employee COLA option. The KPERS 3 COLA gives members the choice to self-fund their own 1% or 2% annual increase. Self-funding means that employees must take a reduction in benefits early on to pay for the future increases. Nebraska’s CB plan and Utah’s hybrid plan also allow for COLAs. Nebraska’s CB plan allows employees to self-fund up to a 2.5% annual increase, and Utah’s hybrid plan has an automatic 2.5% increase that employees do not have to fund.
Outcome Comparison
We used a simulation model to estimate outcomes for KPERS 3 and the other 6 plans in our selection.
- For the purposes of our comparison work, outcomes refer to how a plan performs in a specific scenario and the results it ultimately yields. Outcomes differ from plan components like risk and flexibility because they do not describe the structure or design of a retirement plan. Rather, they measure the real-world value of benefits and costs at retirement. The specific outcome metrics we evaluated were:
- Replacement Ratio: the percentage of an employee’s final, pre-retirement salary that is covered (or “replaced”) by the annualized value of their retirement benefits. For example, a replacement ratio of 70% means that the employee receives 70% of their last salary in annual retirement benefits.
- Total Benefit Value: the total monetary value of an employee’s benefits upon retirement. In some cases, this is simply a final account balance. In other cases, it is the value of future payments discounted to a moment in time. These calculations are based on the future value of regular payments and other factors like mortality expectations.
- Cost Share: the percentage of the total benefit value that was funded through employee contributions, employer contributions, and investment returns.
- Generally, outcomes cannot be directly observed from a plan’s design. They depend on real-world conditions that may fluctuate for different employees. For this reason, we decided to estimate outcomes using a few simple simulations of employee “pathways”. These simulations demonstrate what different employees’ retirement benefits and costs could look like for each of the 7 plans and under different career scenarios.
Our estimates are only a general indicator of plan performance and are based on several key assumptions.
- Our estimates are not based on an actuarial analysis. They are the result of a series of calculations that depend on the set of assumptions listed below. These estimates provide a general indication of performance for a specific scenario. Therefore, different scenarios or different real-world conditions could yield results different from our estimates.
- We defined 6 different employee scenarios for our estimates, which differ based on when the employee starts working under the retirement plan and for how long. Figure 5 shows each of these scenarios and when each employee worked under the plan. As the figure shows, we chose a variety of scenarios to represent various possible career paths. Of the 6 scenarios, Employee 1 represents the highest possible outcomes for all the plans we looked at. That’s because it allows an employee to accumulate years of service or investment earnings for the longest amount of time.
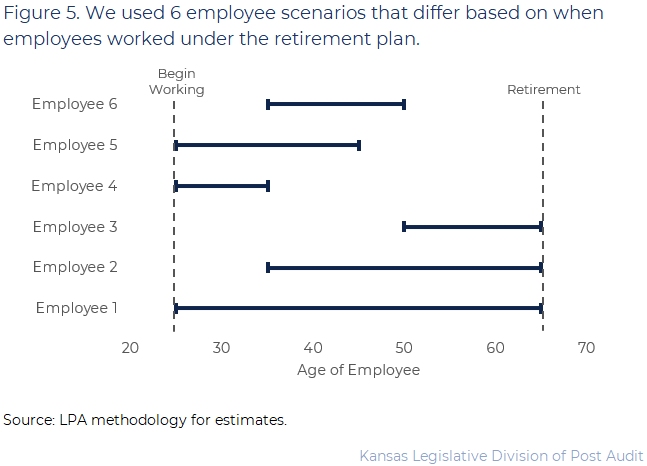
- For the sake of fair comparison, we made all other aspects of the simulation identical across plans and employees. This involved making a few key assumptions about the employees and the real-world conditions that could affect plan benefits and costs. We used the following assumptions for all 6 employee scenarios:
- Employees always work somewhere between the ages of 25 to 65. They work under the retirement plan for the years outlined by their scenario. For all other years, they work elsewhere and do not participate in the retirement plan.
- Employees retire at age 65 and immediately begin receiving benefits from their plan. Employees do not withdraw or rollover any benefits before retiring.
- Employees have a starting salary of $35,000 at age 25, regardless of where they’re working at that age. The salary increases by a percentage each year, yielding a final annual salary of about $188,000 at age 64. We used this starting salary to reflect a potential entry-level position. The salary increases were based on the state employee salary schedule used by KPERS in past actuarial estimates. This schedule accounts for a variety of salary increases, including from promotions and inflation.
- Employees contribute the percentage of their salary that they are required to under the plan in question. Where applicable, however, employees make contributions in an optimal way so as to receive the maximum employer matching contribution.
- Investment returns are 7% annually. This matches the current KPERS investment return assumption, which reflects the expected average return over time. The 7% also applies to plans in which employees determine their own investments. However, in practice, employees with different investment preferences could earn a higher or lower annual return.
- The KPERS 3 dividend return is 2% annually, in addition to the guaranteed 4% minimum interest rate. This is based on the dividend assumption used by KPERS in past actuarial estimates. It is an estimate of the average dividend amount over time when regular market fluctuations are accounted for.
We estimate that employees with a KPERS 3 plan receive a lower proportion of their final salary in annual retirement benefits than most of the 6 other plans.
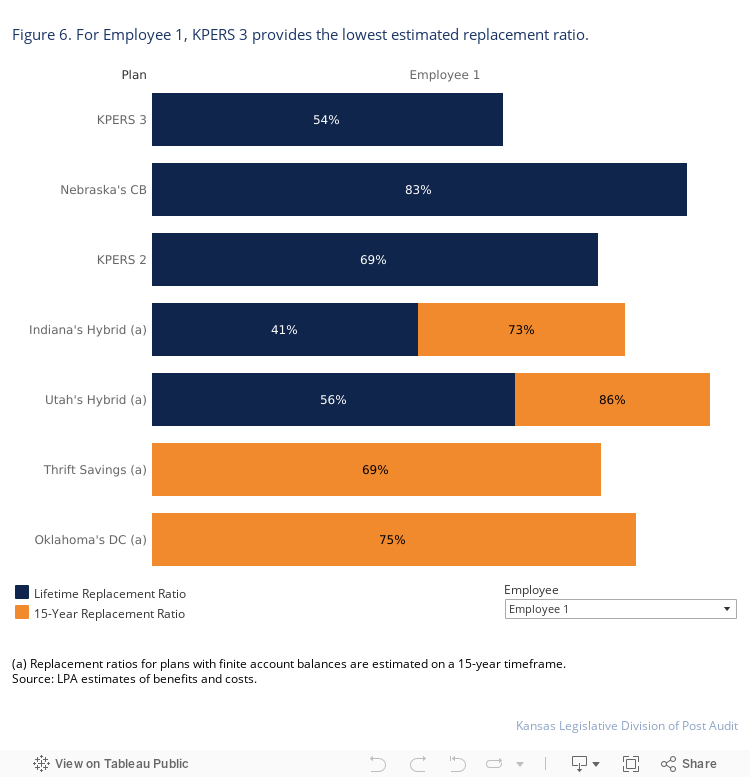
- The percentage of an employee’s final pre-retirement salary that they receive in annual benefits is known as the replacement ratio. We estimated the replacement ratio for all 6 employee scenarios across all 7 retirement plans. To calculate this, we divided each plan’s annual benefit by the employee’s salary at age 64 ($188,000). For some plans, the annual benefit can be calculated directly from the benefit formula. For any plan with a defined contribution component, however, employees have an account balance instead of an annual benefit. In these cases, we estimated the replacement ratio over a period of time rather than a lifetime.
- Figure 6 summarizes the estimated replacement ratios for each scenario. As the figure shows, compared to the other 6 plans, KPERS 3 provides the lowest replacement ratio for Employee 1. Under KPERS 3, they are estimated to have a replacement ratio of 54%. As the figure also shows, that’s 15% less than KPERS 2 (69%). The highest replacement ratio for Employee 1 was under Utah’s hybrid plan: over a 15-year period, this plan would give a replacement ratio of 86%.
- The results are similar for the other employee scenarios: KPERS 3 provides the lowest or one of the lowest replacement ratios. Furthermore, for all plans, replacement ratios tend to be lowest for employees that work under the plan for shorter periods of time. This makes sense because they do not have as many years of service and cannot accumulate as much in benefits.
- One caveat to our estimates is that KPERS 3, KPERS 2, and Nebraska’s CB plan are the only plans we looked at that guarantee all benefits for life. We cannot know for sure what the replacement ratios will be for the defined contribution and hybrid plans. That is because both of these plan types involve finite account balances, and these balances cannot be directly converted into replacement ratios. Our 15-year estimates for these plans represent the replacement ratio an employee would have if they did nothing with their finite account except draw out benefits for 15 years until no funds remained. In reality, retirees may continue to invest this account after retirement. They may also withdraw their funds over a longer or shorter period of time. This could result in higher or lower replacement ratios than our estimates.
We estimate that KPERS 3 generally provides lower benefits and requires employees to fund a larger share of those benefits than most of the other 6 plans.
- We also estimated the impact employee and employer contributions had on the total retirement benefits for each employee scenario. To do this, we first estimated the total benefit value for each employee scenario and plan. Then, we estimated how much of that total came from employee contributions and how much came from employer contributions. Our estimates also included the investment returns earned on those contributions. Unlike replacement ratio, this allowed us to estimate the real dollar value of retirement benefits at the time of retirement, rather than over time. It also allowed us to estimate what percentage of benefits are funded from the employee and employer.
- There are two important caveats to this analysis. First, our estimate does not use actual employer contributions as part of its calculation. This is because, for most plans, employer contributions are credited to a pooled fund rather than an individual’s account. As such, we couldn’t track how much of an individual employee’s benefits came from employer contributions. Instead, we estimated employer contributions (and returns) as the amount of benefits that remained after employee contributions and returns were calculated. Second, some plans like KPERS 2 provide regular lifetime benefits rather than a finite account balance. For consistency, the total benefit value for these plans is estimated using the KPERS 3 “annuity factor”, which converts an account balance to a lifetime benefit and vice versa.
- Figure 7 shows the estimated total benefit values for each plan. It also shows the percentage of the total benefit value that was funded by the employees and employers, including their respective contributions and the investment returns earned on those contributions. As the figure shows, KPERS 3 yields the lowest benefits for Employee 1, with a $1.32 million total benefit value at retirement. This makes sense because KPERS also provided the lowest replacement ratio, and a lower total benefit value generally corresponds to a lower replacement ratio.
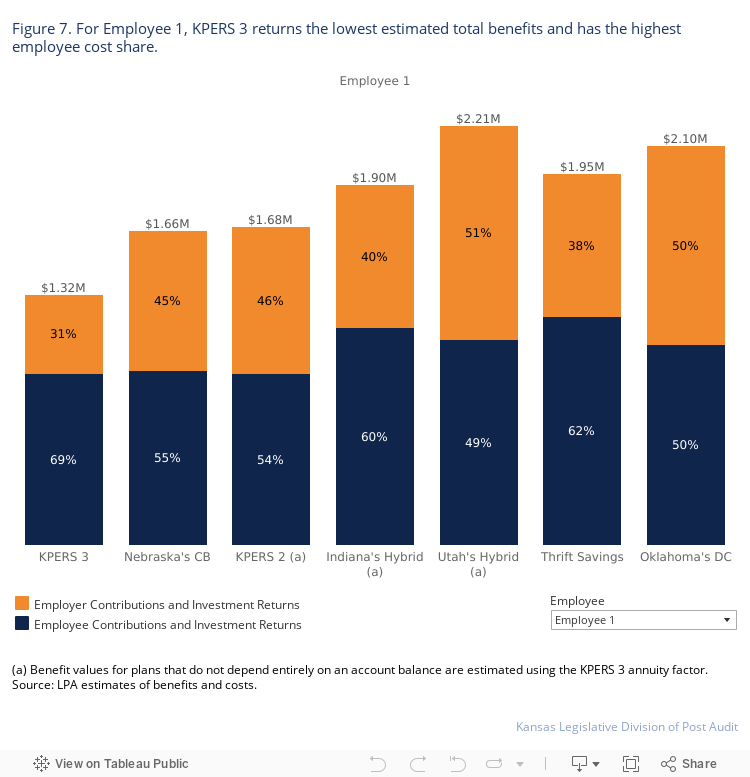
- Figure 7 also shows that the cost share for KPERS 3 is made up primarily of the employee’s contributions and investment returns earned on those contributions (69%). The state covers 31% ($413,000) of the final value through their contributions and investment returns. This is the lowest cost share for employers and the highest for employees in this scenario. The next lowest cost share for employers is the Thrift Savings plan at 38%.
- The results are similar for Employees 2 through 6 as well. Across all scenarios, KPERS 3 has the lowest or second-lowest total benefit value at retirement. Additionally, the KPERS 3 employee cost share is the highest or one of the highest across all scenarios. Compared to Nebraska’s CB plan, KPERS 3 provided a lower total benefit value and required employees to fund a larger share of their benefits in all 6 scenarios.
Impact
We conducted a survey, interviewed state officials, and reviewed relevant literature to understand how retirement plans impact state staffing.
- Part of our audit objective was to determine the impact different retirement plans can have on employee decision-making. To do this, we reviewed existing literature, surveyed active and inactive KPERS employees, and interviewed officials from 7 public entities participating in KPERS. To get a good cross-section of different KPERS employers, we selected entities of various sizes from state agencies, counties, and school districts. The entities we selected to interview and survey were:
- Ford County
- Johnson County
- The Department of Children and Families
- The Department of Transportation
- The Department of Wildlife and Parks
- USD 350 St. John-Hudson
- USD 450 Shawnee Heights
- We distributed an electronic survey to about 8,800 current and former employees from these 7 entities. This included active members of KPERS 1, 2, and 3, as well as retirees and inactive members of KPERS 3. Of these, about 1,300 people fully completed the survey, for a 15% response rate. We also met with officials from these entities to discuss the impact they thought KPERS 3 has had on their ability to hire and retain employees.
- We reviewed existing literature into how retirement plans impact employee decision-making. Ultimately, we found 6 studies that examined the effects of retirement plans on employee hiring and retention. These 6 studies included academic articles, meta-analyses, and survey reviews.
Defined benefit plans like KPERS 1 and 2 likely help retain employees better than other plan types.
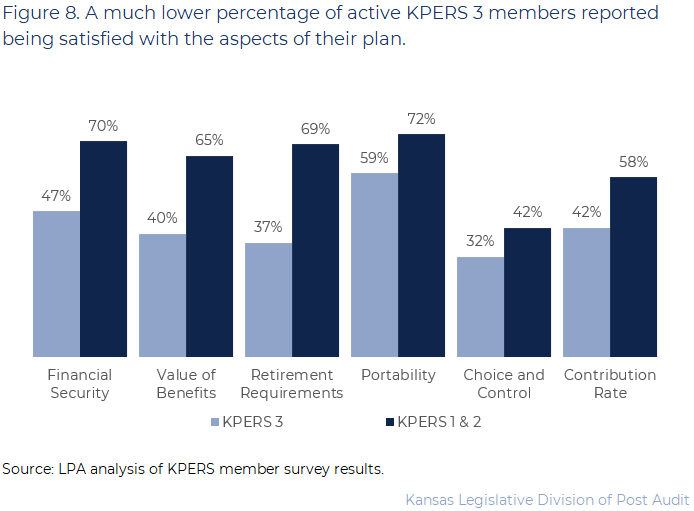
- On average, KPERS 1 and 2 (defined benefit plan) members we surveyed reported being more satisfied with their benefits than KPERS 3 (cash balance plan) members. Figure 8 summarizes how employees rated their satisfaction with a variety of plan aspects, such as the value of benefits and the choice and control they have. We asked employees to rate their satisfaction with these aspects because satisfaction can be an indicator of how much employees intend to leave or remain at their job in response to their retirement plan. As the figure shows, for every plan aspect, a much lower percentage of KPERS 3 members reported being satisfied compared to KPERS 1 and 2 members.
- The interviews we conducted revealed a similar sentiment among Kansas employers. Officials from 4 of the 7 entities we talked to said that the KPERS 3 plan made it harder to retain employees than KPERS 1 and 2. Some explained that they often have high turnover in the first few years after hiring. They said they believe that the KPERS 3 retirement plan is not attractive enough to incentivize new employees to remain for the long term. Some also said that there is a perception among employees that KPERS 3 provides lower benefits compared to KPERS 1 and 2.
- Conclusions from existing literature generally aligned with the results of our surveys and interviews. 2 studies found that employees were more likely to remain in their job if they were covered by a defined benefit plan. Another study found that employees under defined benefit plans were more satisfied with their plan than employees under defined contribution plans. Some studies also explained that, while employees may value the flexibility offered by other plan types like defined contribution plans, they are ultimately more satisfied with the stability and lower risk offered by defined benefit plans.
Retirement plan types do not appear to have a significant impact on employers’ ability to hire new employees.
- The employee survey results demonstrated that retirement plans may have less of an effect on hiring. When asked about how important their retirement plan was to their decision to accept their current job, active KPERS 3 members still said their plan was less important than KPERS 1 and 2 members on average. However, the difference in importance between KPERS 3 and KPERS 1 and 2 was considerably smaller than the difference in importance for job retention. Generally, survey results indicated that KPERS 3 had a smaller impact on members’ decision to accept their job than to remain at their job.
- Our interviews with agency officials also indicated that KPERS 3 does not appear to affect hiring as much as retention. While officials from USD 350 and USD 450 told us that they believe the KPERS 3 plan does not help attract talented employees, officials from the majority of entities agreed that the plan has had little to no effect on their ability to recruit. They said that this is because prospective employees do not usually know enough about the plan or are too young to prioritize it.
- Lastly, we did not find any existing studies that demonstrated a significant effect between retirement plan types and the likelihood of someone accepting a new job. Furthermore, 1 of the studies we examined found that retirement plan type had no effect on prospective employees’ decisions to accept a new job when other compensation factors, such as salary, were considered as well. The study noted that different kinds of employees may value very different aspects of a plan. This may explain why there was no consistent overall effect of retirement plan type.
- Taken altogether, these results indicate that retirement plan types have a greater effect on employee retention than hiring. This difference may partly be due to variation in knowledge and preferences at different stages of an employee’s career. In general, newer employees may be less familiar with prospective retirement plans and more concerned with other aspects of the job. Conversely, employees who have been working at their job for some time may eventually shift their focus to retirement and be more cognizant of the differences between plans.
Conclusion
KPERS 3 was introduced to help strengthen the KPERS trust fund following the 2008 – 2009 recession. Although the trust fund has improved, it’s unclear how much has been due to KPERS 3. Unlike KPERS 1 and 2, KPERS 3 requires employees to share some financial risk with the state. As a cash balance plan, KPERS 3 doesn’t give employees much flexibility over how to manage that risk. We found that KPERS 3 is most like other states’ cash balance and hybrid plans. However, hybrid plans give employees more flexibility to manage their share of the financial risk. Generally, survey responses indicated that KPERS 1 and 2 members were more satisfied with their benefits than KPERS 3 members. They were also more likely to remain at their current positions. That’s expected because KPERS 3 requires employees to share some financial risk with the state, gives them limited flexibility, and may provide fewer overall benefits.
Recommendations
We did not make any recommendations for this audit.
Agency Response
On January 18, 2024 we provided the draft audit report to the Kansas Public Employees Retirement System (KPERS). Its response is below.
January 25, 2024
Ms. Chris Clarke
Post Auditor
Legislative Division of Post Audit
800 SW Jackson, Suite 1200
Topeka, KS 66612
Dear Post Auditor Clarke:
Thank you for the opportunity to review the recent audit, Reviewing the KPERS 3 Retirement Plan. The report was beneficial and informative.
The Kansas Public Employees Retirement System appreciates the analysis and evaluation of the KPERS 3 plan compared to other retirement plan designs. It is very helpful to have the Legislative Division of Post Audit’s non-partisan review of the newest KPERS plan, as it enters its ninth year. KPERS believes the report will help the Legislature better understand the flexibility and financial risk associated with KPERS 3, as well as the impact on our members and KPERS affiliated employers.
We appreciate the efforts of Auditors Graber, Middendorf and Smith, who were thorough and responsive throughout the audit process. Please let me know if you need any additional information or assistance in the completion of this report. Thank you again for the opportunity to review this audit.
Sincerely,
Alan D. Conroy
Executive Director
cc: Matt Etzel, Performance Audit Manager, Legislative Division of Post Audit
Cade Graber, Senior Auditor, Legislative Division of Post Audit
Sarah Middendorf, Auditor, Legislative Division of Post Audit
Brendan Smith, Associate Auditor, Legislative Division of Post Audit
Appendix A – Cited References
This appendix lists the major publications we referenced in this report.
- Employees’ Retirement Choices, Perceptions and Understanding: A Review of Selected Survey and Empirical Behavioral Decision-Making Research (March, 2014). Jodi DiCenzo.
- Financial Advice, Plan Choice, and Retirement Plan Satisfaction (2021). Michael P. Ryan and Brenda J. Cude.
- Perceptions of Retirement Affect Career Commitment: The Mediating Role of Retirement System Satisfaction for Two Teacher Age Groups (September, 2014). Justin L. Smith, Sharon Conley, and Sukkyung You.
- Public Employee Retention Responses to Alternative Retirement Plan Design (2021). David Knapp, Beth J. Asch, and Michael G. Mattock.
- The Three Rs of Teacher Pension Plans: Recruitment, Retention, and Retirement (October, 2011). Ilana Boivie.
- What Retirement Plan Features do Employees Really Want? (March, 2023). Timothy Geddes, Ian Raver, and Alissa Levy.